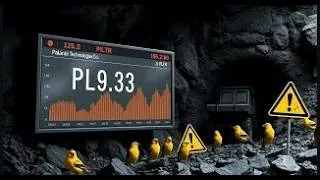
PALANTIR STOCK VOLATILITY: A CANARY IN THE COAL MINE FOR TECH STOCK BUBBLE AND MARKET CORRECTION ?
Palantir Technologies (PLTR) has been one of the most volatile stocks in the technology sector, with its valuation soaring amid speculative enthusiasm. Despite the company’s strong government contracts and AI-driven analytics, its fundamental metrics suggest that the stock may be…

Q1 2025 Seasonal Volatility and Stock Market Correction: A Forecasting Analysis
The first quarter of 2025 may bring increased stock market volatility, potentially leading to a market correction. A detailed analysis of major U.S. indices, including the Dow Jones Industrial Average (DJIA), S&P 500, NASDAQ 100, and Russell 3000, suggests that…
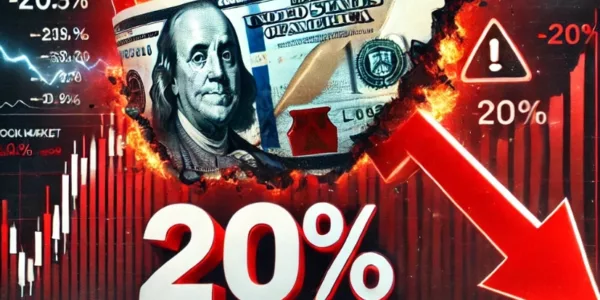

Leverage effect could bring seasonal Q1 stock market drawdown
The recent Q4 volatility patterns of the major U.S stock market Index, such as Dow Jones Industrial Average, S&P500, Nasdaq100 and Russell 3000 could have been a forthcoming market signal of a volatility build-up going into Q1 2025, as among…
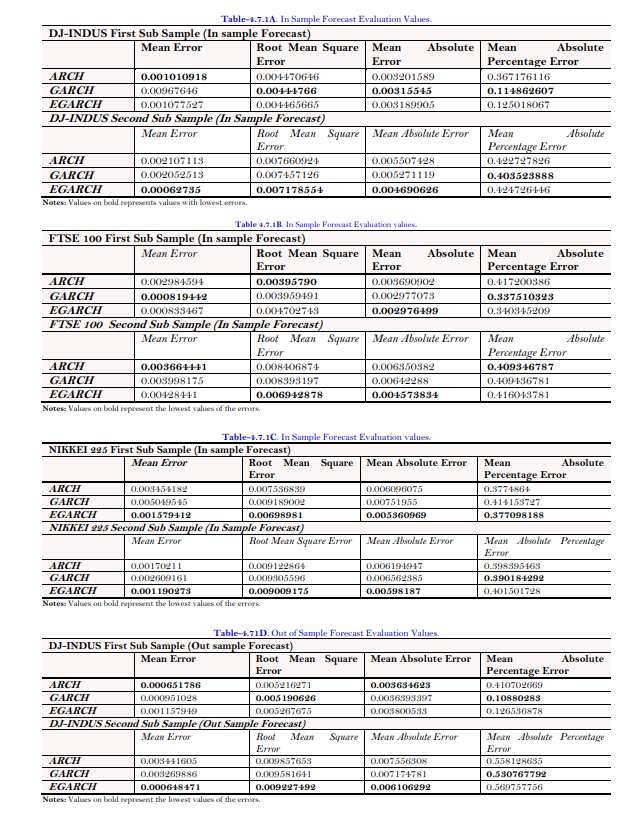
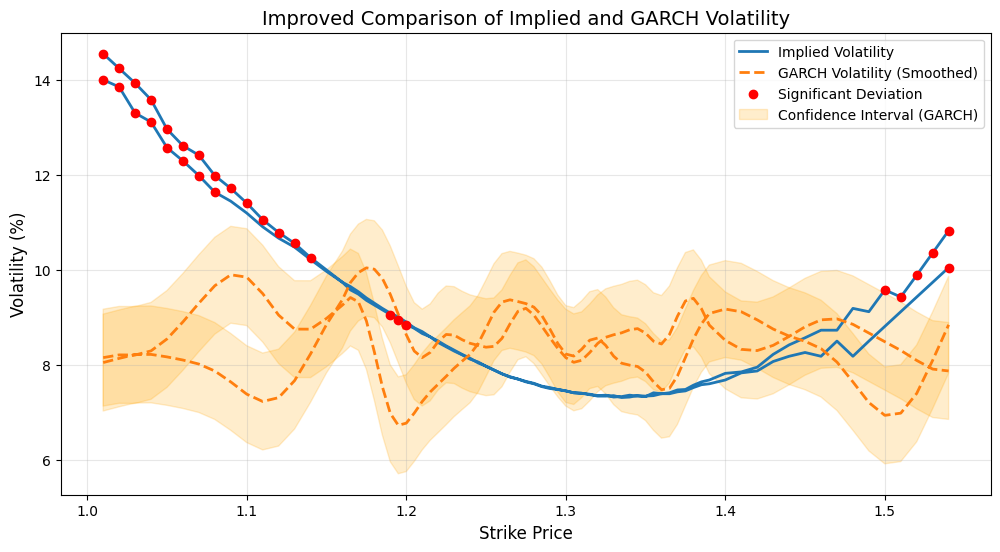
FORECASTING EQUITY INDEX VOLATILITY: EMPIRICAL EVIDENCE FROM JAPAN,UK AND USA DATA
Understanding and forecasting equity market volatility has become an essential focus for financial analysts, policymakers, and academic researchers. In this working paper are explained the predictive capabilities of non-linear models—ARCH, GARCH, and EGARCH—using weekly return data from Japan, the UK,…
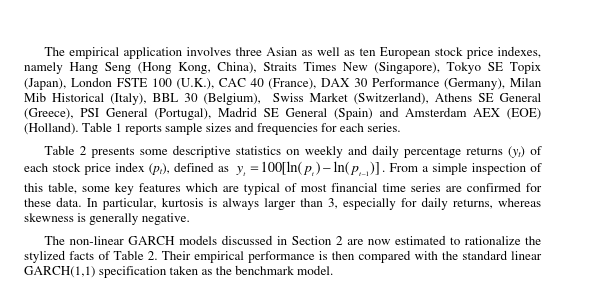
Forecasting Volatility in Asianand European Stock Marketswith Asymmetric GARCHModels
The dynamics of financial market volatility have long captured the interest of researchers and practitioners alike, particularly due to its implications for risk management, portfolio allocation, and derivatives pricing. In this working paper read about the predictive performance of asymmetric…
The many reasons why the British Pound can depreciate below parity against the USDollar
When considering the simple data of United States GDP of $27.3 Trillion Dollars in aggregate compare and contrast with United Kingdom GDP $ 3.34 Trillion Dollars, then with virtue of simple proportion anybody can understand that the United States GDP…
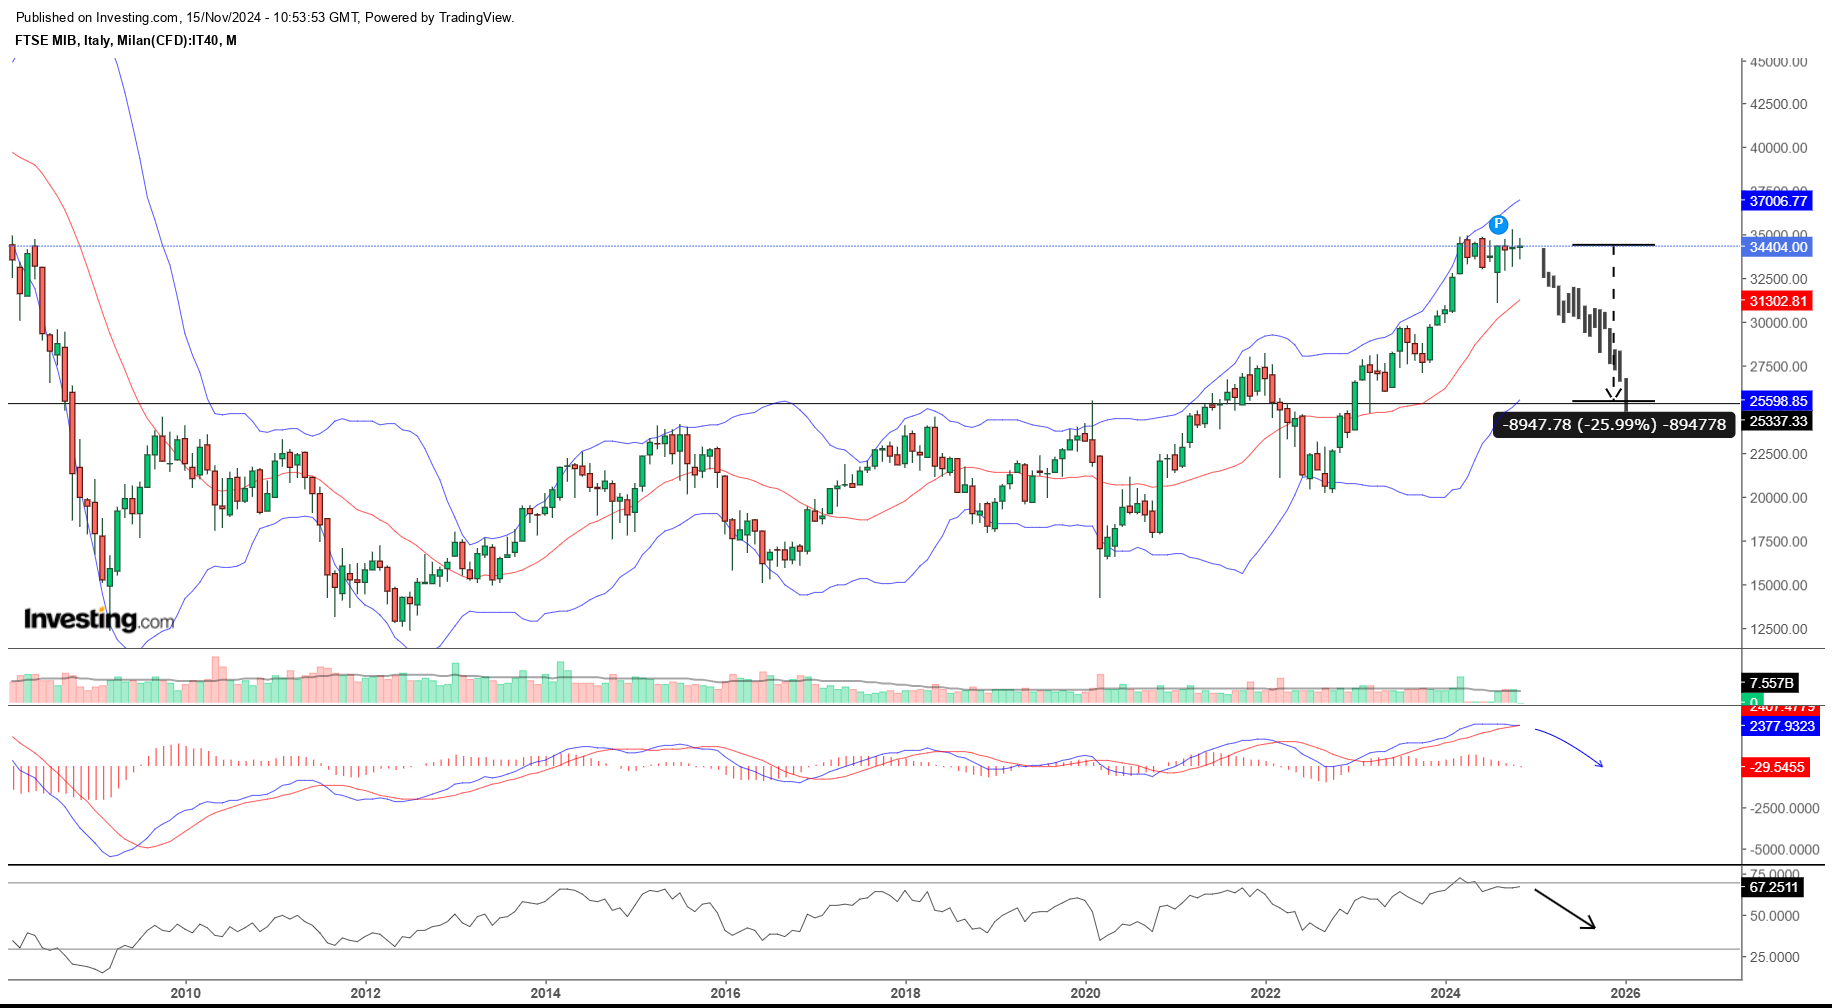
FTSEMIB timeseries volatility study and -26% volatility risk scenario
An extensive time-series analysis has been carried over the FTSEMIB to gather statistical parameters and analyse the FTSEMIB daily and cumulative returns volatility patterns. The FTSE MIB chart has already been drifting in a sideways pattern after a BollingerBand technical…
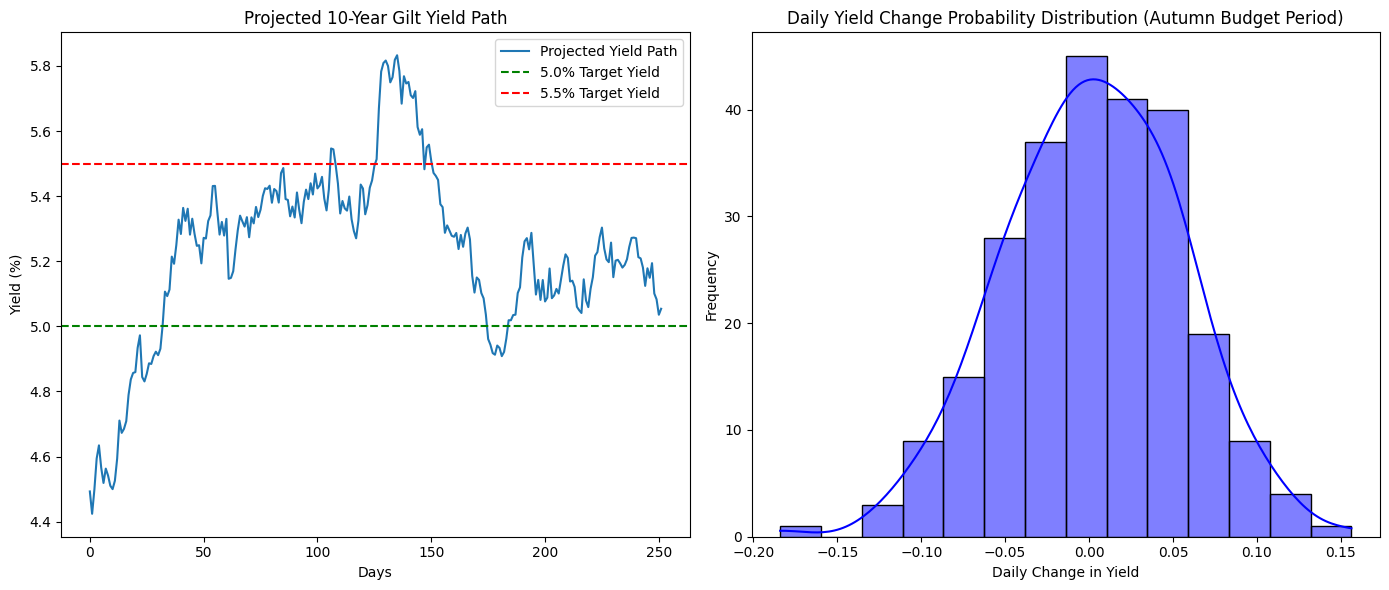
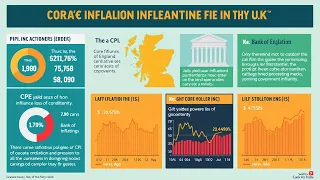
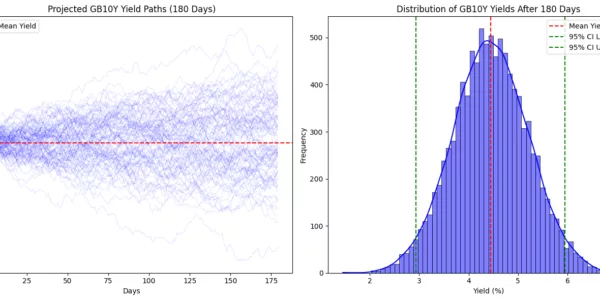
UK GILT yield curve at risk of sustained higher volatility
From a technical standpoint, the bond market reaction function to the Autumn Budget 2024 has been similar to the mini-budget 2022, indeed making the 10Y GILT yield increase to 4.54% above the 2022 of 4.32%, while the scale of change…

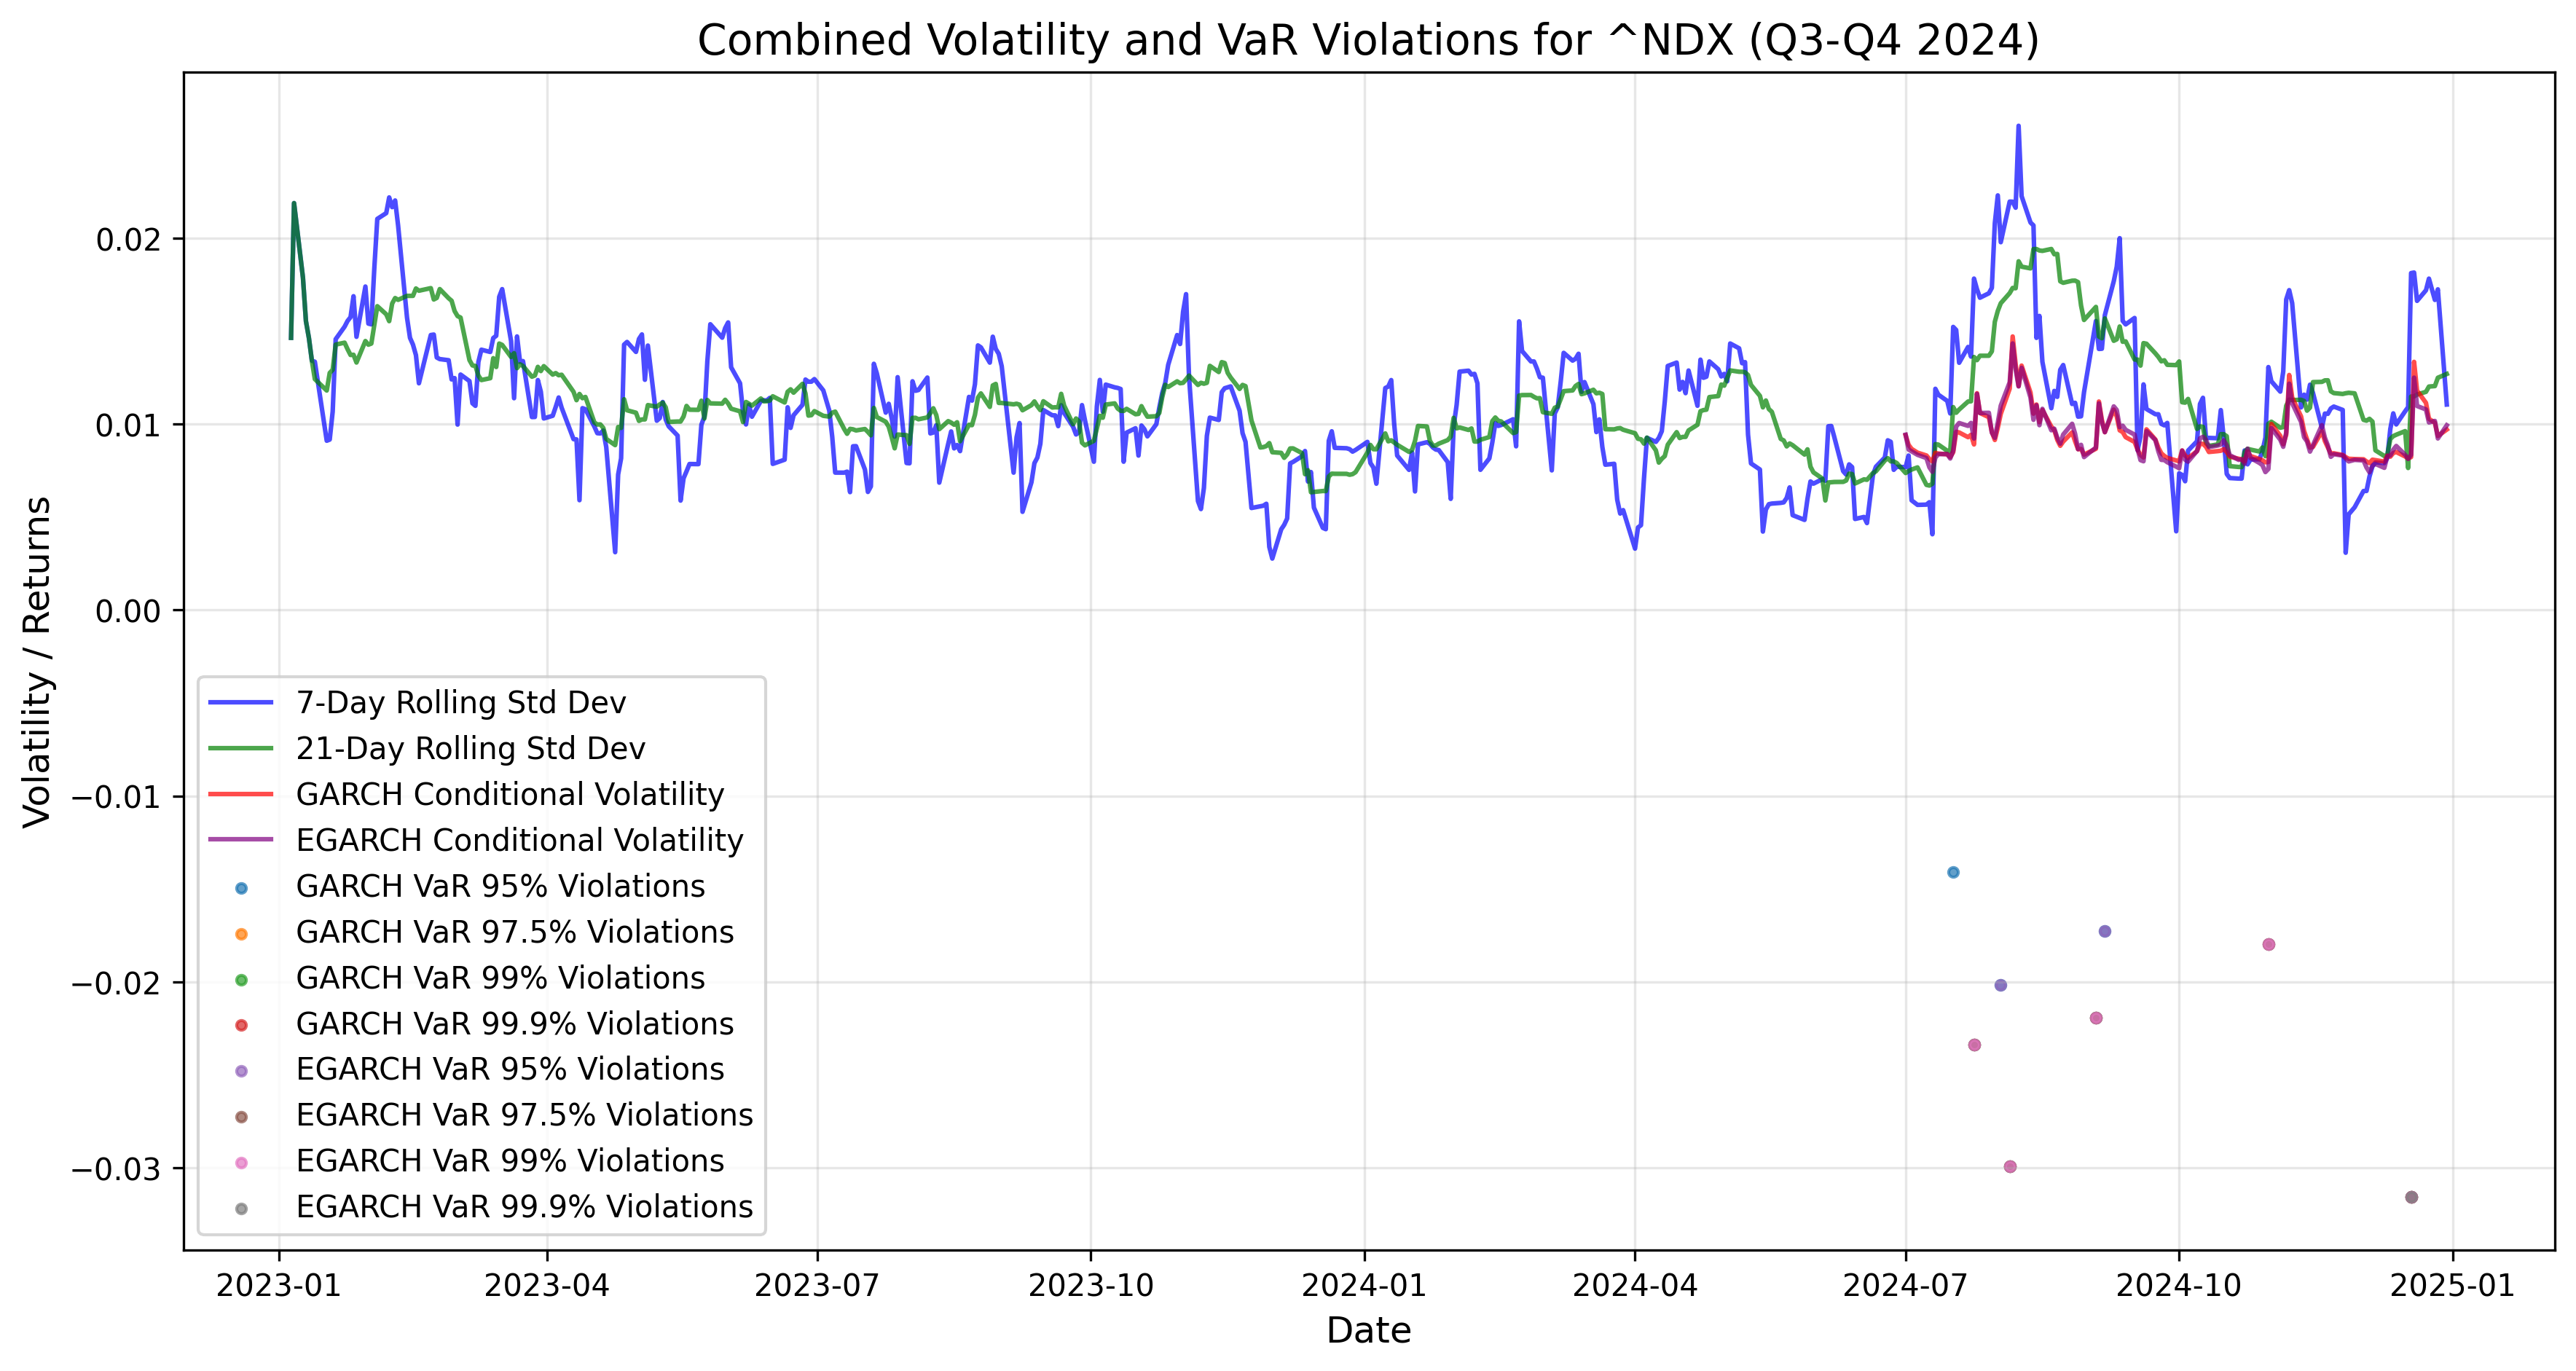
NASDAQ Halloween Scare and volatility pumpkin spike
As October rolls to its end, markets have their own way of embracing the Halloween spirit, and it seems the NASDAQ-100 (NDX) has chosen a rather spooky route. Traders and investors are beginning to hear the ominous toll of “Hell’s…
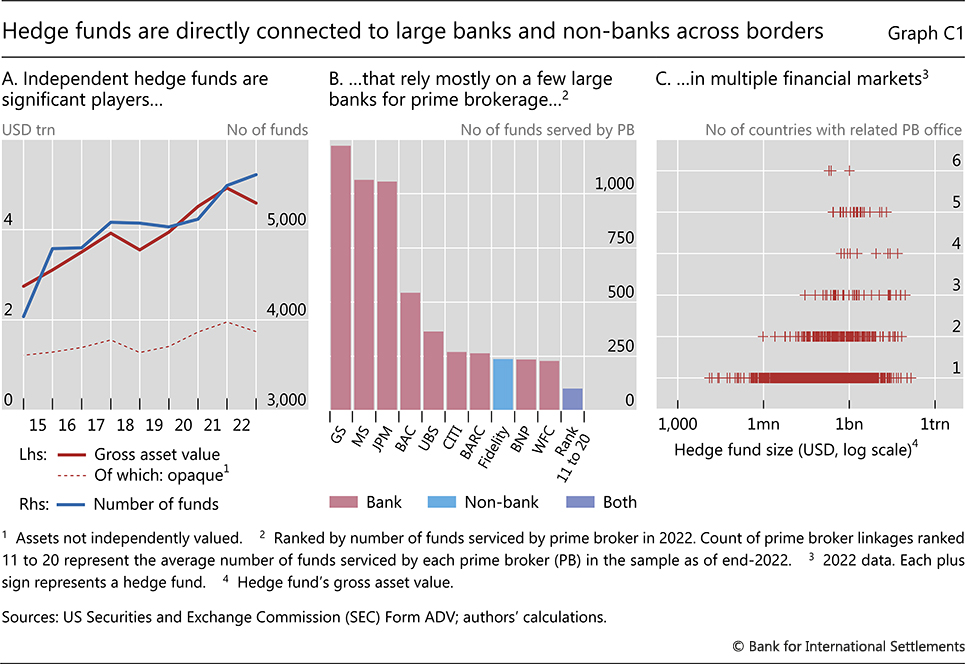
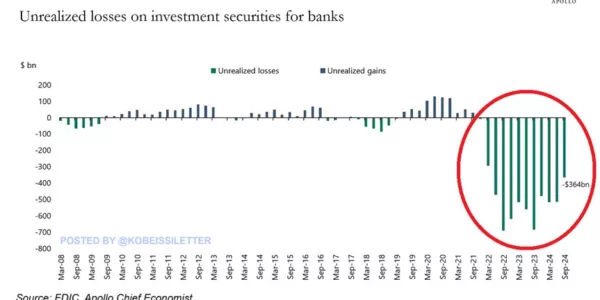
The Current State of Hedge Funds’ Leverage and Implications for Big Banks
Hedge funds, known for their aggressive and often highly speculative investment strategies, have leveraged their portfolios to extraordinary levels in recent years. Hedge fund leverage has surged to an unprecedented $28 trillion, marking a significant risk factor within the financial system.
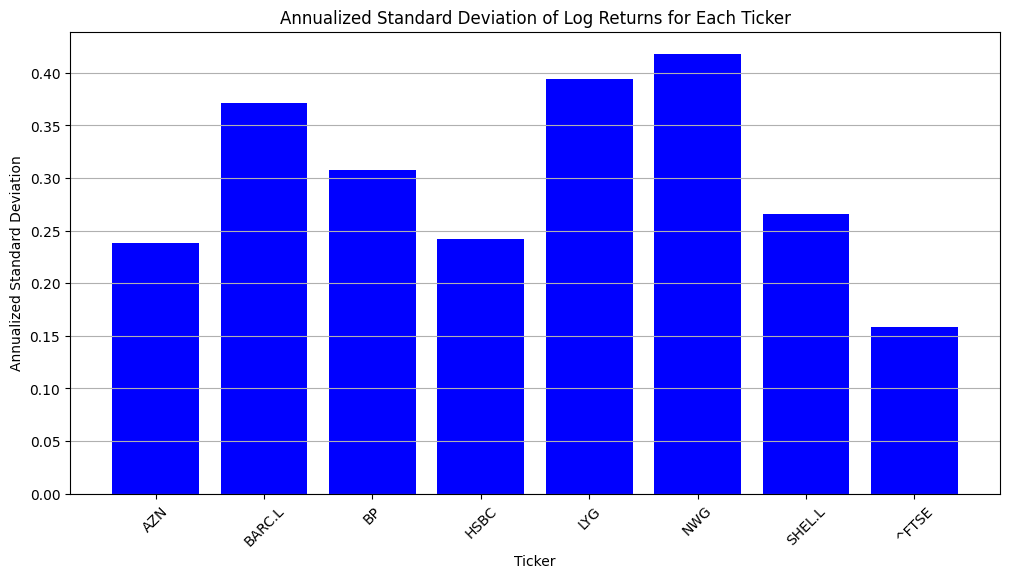
Extracting Market Performance and Volatility Patterns of Blue-Chip Stocks and the FTSE100 Index
Samples of FTSE100 blue chip stocks and the FTSE100 index have been elaborated to understand the stocks’ returns and the index returns since 2010 up to date. A wide variety of descriptive statistics and volatility measures have been assembled, meanwhile,…


