As October rolls to its end, markets have their own way of embracing the Halloween spirit, and it seems the NASDAQ-100 (NDX) has chosen a rather spooky route. Traders and investors are beginning to hear the ominous toll of “Hell’s Bells”, as volatility rises and warnings of overvaluation are making their rounds. With the NDX reaching historically high valuations and increased market uncertainty, it might just be the perfect time for a Halloween scare.
The Ghost of Overvaluation
The NASDAQ100, the tech-heavy index that includes some of the biggest names in global markets—Apple, Microsoft, Google, and Amazon—has enjoyed an impressive rally over the last few years. Fueled by a tech boom, low interest rates, and unprecedented levels of liquidity, the NDX reached new highs, but the bell is starting to toll for what could be a sharp pullback. The current P/E ratios of key stocks in the index reveal overvaluation that cannot be ignored. The giants of the tech world like Apple and Tesla are sporting price-to-earnings ratios (P/E) well above historical norms. Tesla, for instance, has a P/E ratio nearing 71, a clear sign that expectations are sky-high. Historically, P/E ratios above 30 indicate a potential bubble, while the broader index also signals, it’s trading at expensive multiples. With such high valuations, there’s little room for disappointment, and any sign of trouble—whether it’s from earnings misses, interest rate hikes, or geopolitical risks—could send stocks tumbling. As we look at the overall NASDAQ100 P/E ratio, the concern becomes more apparent: an expensive market in a time of rising volatility is a recipe for market jitters.
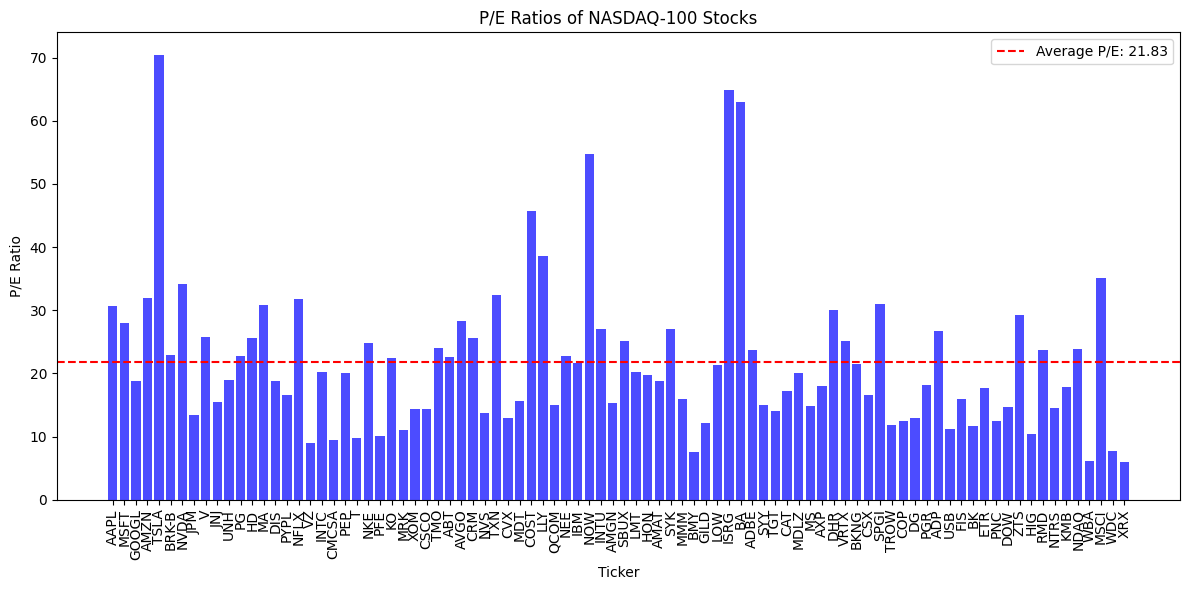
The sum of all P/E ratios for the NASDAQ100 stands at 1921.10, with an average P/E ratio of 21.83 across its major constituents. Historically, a P/E ratio above 20 is considered a sign of overvaluation, as it implies that investors are willing to pay a high premium for future earnings. The current level suggests that the market is pricing in extremely optimistic growth expectations for tech giants, which could be unsustainable, especially in a higher interest rate environment. Considering the elevated P/E, the NASDAQ100 could be prone to a downward drift. If earnings disappoint or macroeconomic conditions worsen, investors may reevaluate these valuations, leading to a steep correction. The index would likely need to retrace 10-15% or more to bring these P/E ratios back in line with historical norms and realistic growth prospects. The gap between current prices and fundamental value indicates that the index may be poised for a sharp decline.
Volatility: The Shadow in the Market
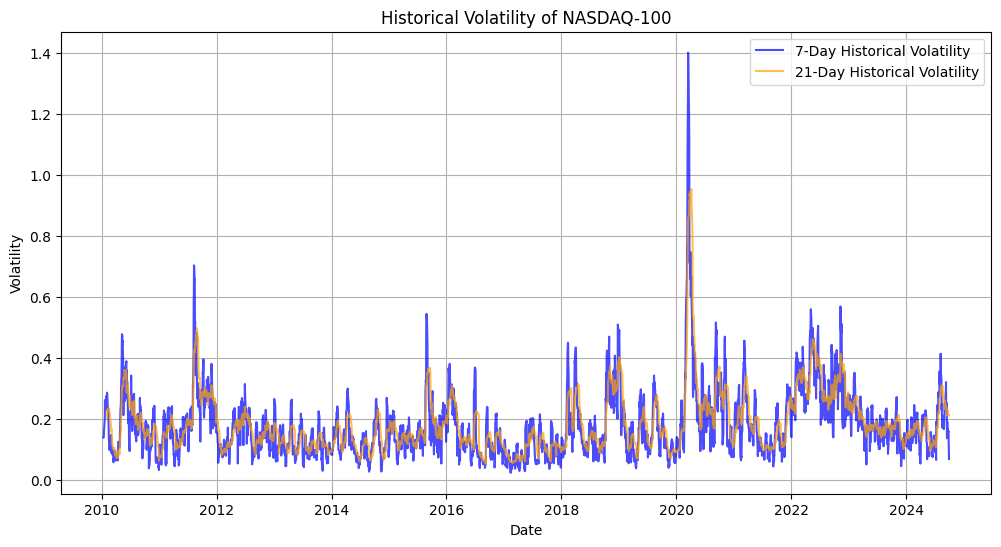
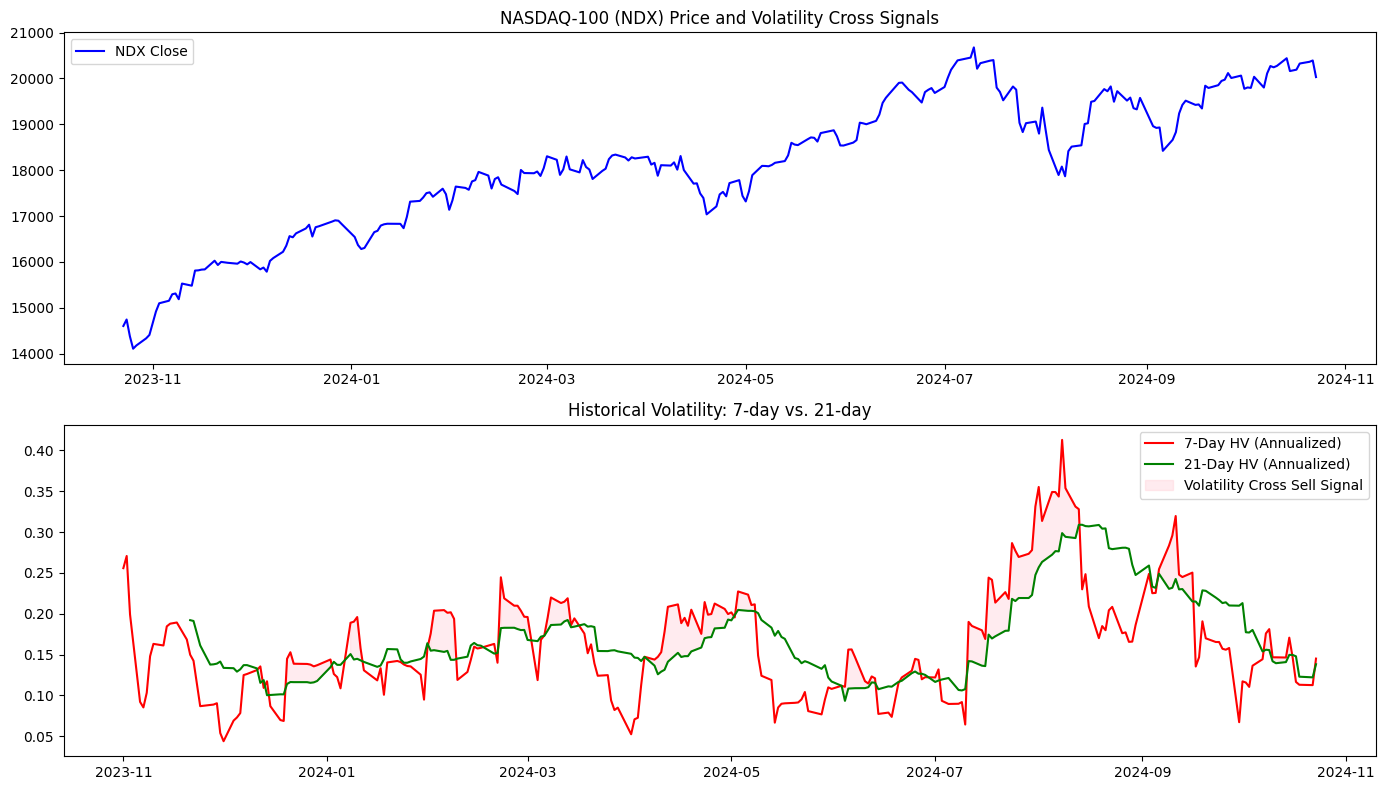
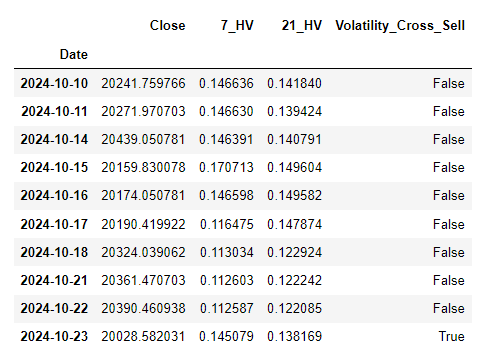
Volatility has begun to drift back into the picture. Using the 7-day and 21-day historical volatility (HV) measures, we can detect the shifts in market sentiment. Volatility spikes typically precede significant market movements, and when short-term volatility (7-day HV) crosses above long-term volatility (21-day HV), it’s often a signal of rising market uncertainty. Looking at the recent volatility cross in the NDX, there’s been a clear shift: short-term volatility has overtaken long-term volatility, signalling an increase in uncertainty. This is the type of volatility cross that traders view as a potential sell signal. Short-term market jitters reflect fears of downside pressure, and in an overvalued market, it could be a warning that the index is due for a major correction. In fact time series study has been made for the Nasdaq100, and the average 7-Days Historical Volatility (annualised) = 14,9% while the 21-Days Historical Volatility (annualised) =14%, these are data pulled from 2010 onwards, although the clear market signal could have been maturing during this week, with a verified 7-day historical vol average crossing through the 21-days historical vol, that has been verified in the models and displayed with the graph below.
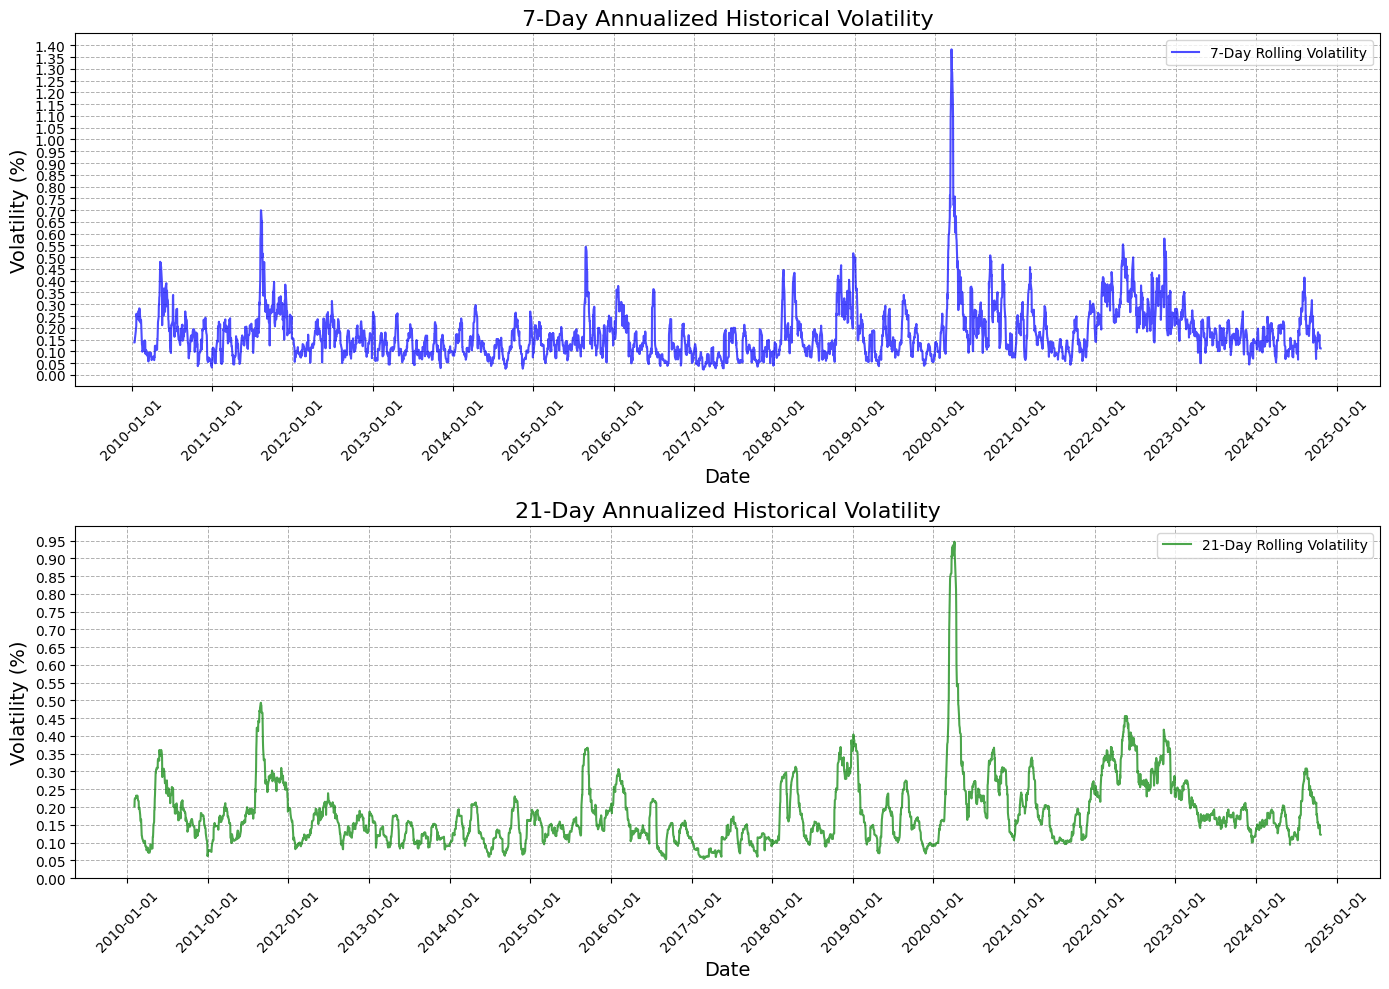
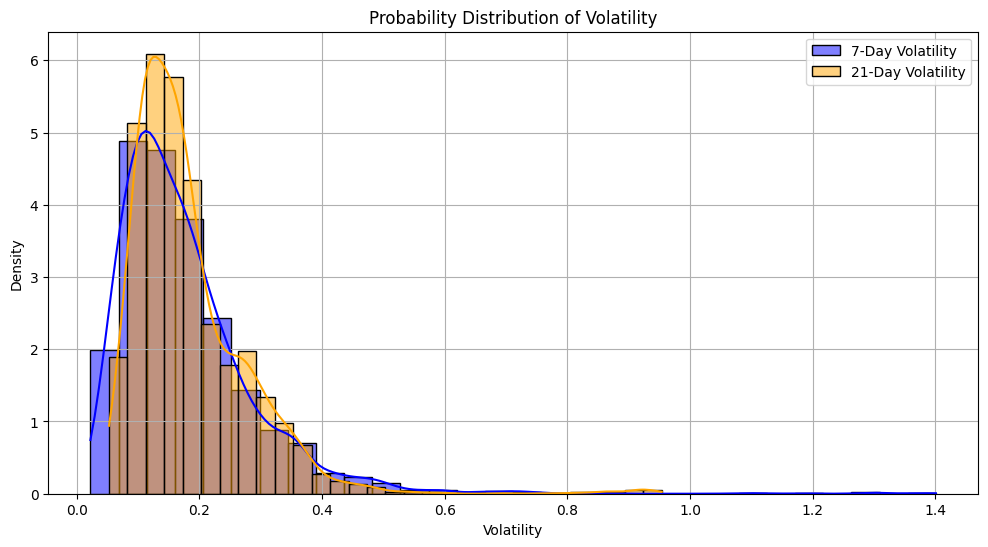
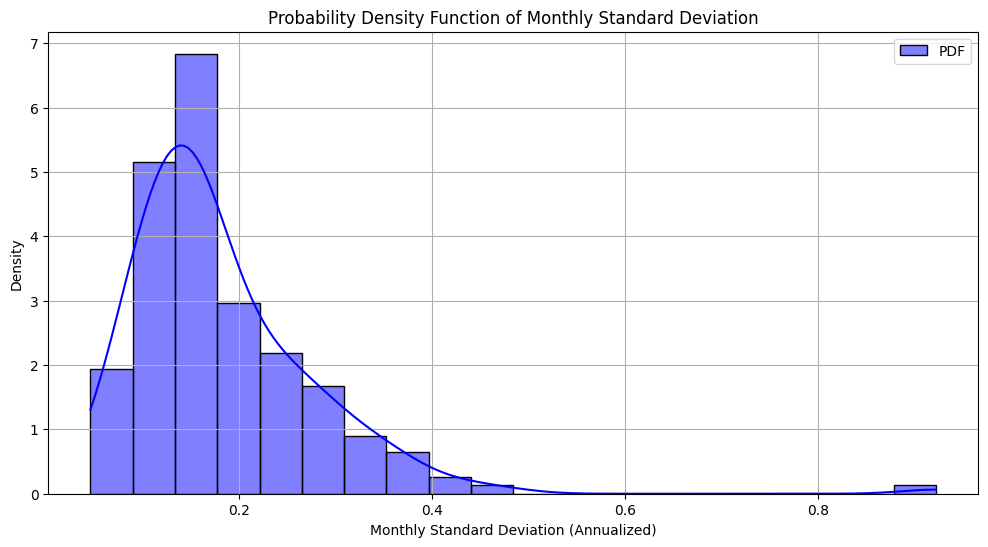
The Probability Density of the Volatility graph also can provide insightful data, as the probability density distribution of volatility has a higher tail risk in the 7-Days Historical Volatility than in the 21-Days HVol, this signals that spikes in Nasdaq100 Volatility are more probable in the 7-Days rolling HVol and taking this data with the signal of 7-Day HVol crossing above the 21-Day HVol this would mean that volatility should be spiking in the next 7 to 21 trading days, in time for Halloween.
   Volatility  7-Day PDF  21-Day PDF
0    0.022363   0.743844    0.070393
1    0.036285   1.467705    0.287837
2    0.050208   2.377022    0.812225
3    0.064131   3.297973    1.706750
4    0.078054   4.092516    2.915517
Garch Model Volatility Forecast
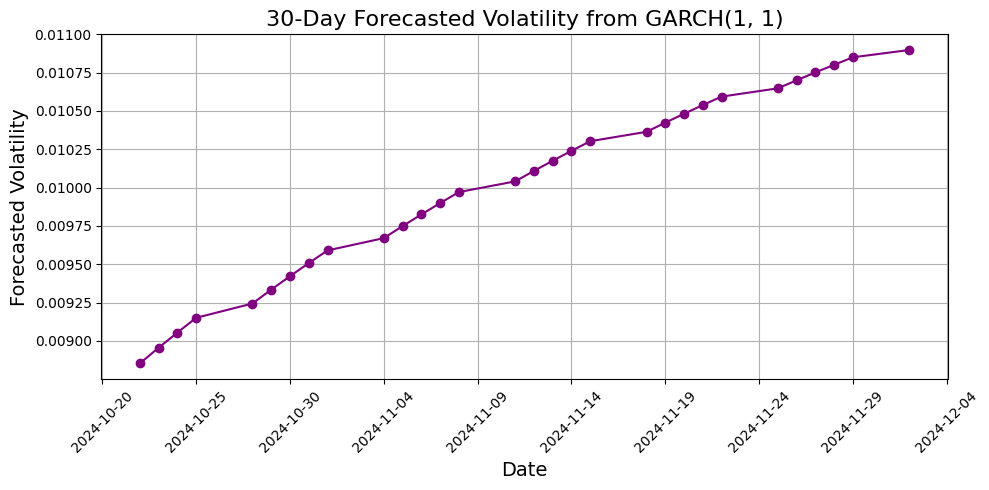
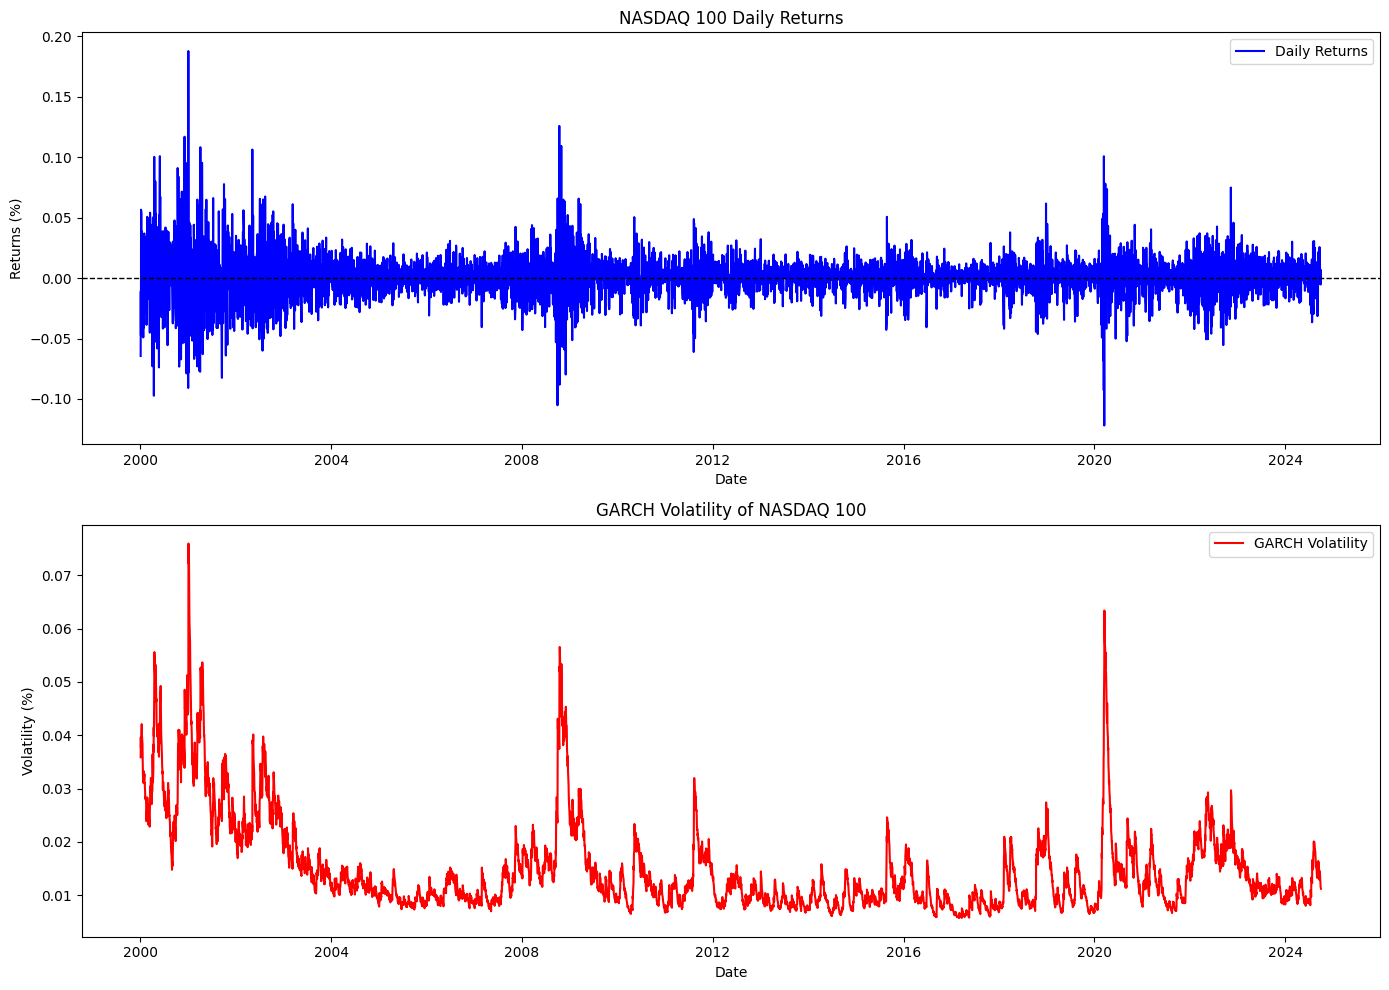
The output of the GARCH model analysis provides crucial insights into the volatility dynamics of the NDX (NASDAQ100) index returns, which can help justify a potential sell-off. The model indicates a constant mean return (μ\muμ) of approximately 0.001065, with a highly significant t-value of 57.255 and a p-value of 0.000. This suggests that the average return is statistically significant and positive. However, the volatility components reveal more critical information. The coefficient for ω\omegaω (the constant term in the volatility equation) is extremely small at 3.3893e-06, indicating that even under normal conditions, there is minimal baseline volatility. The α[1]\alpha[1]α[1] parameter, representing the impact of recent shocks to volatility, is 0.1000, while β[1]\beta[1]β[1] is 0.8800. This implies that a significant portion of the volatility is persistent, as indicated by the high value of β[1]\beta[1]β[1]. The combination of a relatively high persistence in volatility and a low ω\omegaω suggests that the index is likely to experience increased volatility in response to shocks. The low overall volatility and the potential for sudden spikes in market reactions—combined with external factors such as economic uncertainty, rising interest rates, or geopolitical tensions—may make it prudent for investors to consider a sell-off strategy. The prevailing conditions may not only lead to heightened market fluctuations but could also provoke fear among investors, potentially resulting in a broader market decline. Therefore, the current GARCH model output suggests that the NDX may be on the brink of a sell-off as volatility dynamics favour downward adjustments in response to negative shocks
Halloween Signal: A Market Pullback Brewing?
In the market, fear often feeds on itself. When volatility increases and valuations are stretched, any negative news can act as a catalyst, sending stocks into a sharp decline. With tech stocks leading the charge into high valuations, the NDX may be setting itself up for a Halloween trick—a sharp pullback that leaves investors spooked. As we approach the end of October, many market analysts are watching closely. The Federal Reserve’s interest rate policy, combined with geopolitical tensions and economic uncertainty, provides the perfect backdrop for a potential market scare. The NDX has shown resilience in the past, but every market run has its limits.
How Far Could the NDX Retrace?
The critical question for investors now is: how far does the NASDAQ-100 need to retrace for its valuation to return to more reasonable levels? Looking at historical corrections, a pullback of 10-15% would not be out of the question, particularly if volatility remains elevated and interest rates continue to rise. Such a pullback would bring the P/E ratios of many stocks closer to their historical averages and could shake out some of the speculative excesses that have built up over the last few years. While no one can predict the exact timing of such a move, the signs are clear: the NASDAQ-100 is overvalued, volatility is rising, and the market could be in for a rough ride in the months ahead. As we head into the final months of the year, investors should heed the warning signs. With volatility crossing into sell-signal territory and the NASDAQ-100 trading at stretched valuations, there’s a real risk that the market could experience a significant correction. This Halloween, the scariest thing for investors may not be ghosts or ghouls—but the tolling of Hell’s Bells in the stock market. Traders would do well to keep an eye on the volatility cross and the increasing risk of a tech sector pullback. The market may soon deliver a fright that echoes far beyond Halloween.