FTSEMIB timeseries volatility study and -26% volatility risk scenario
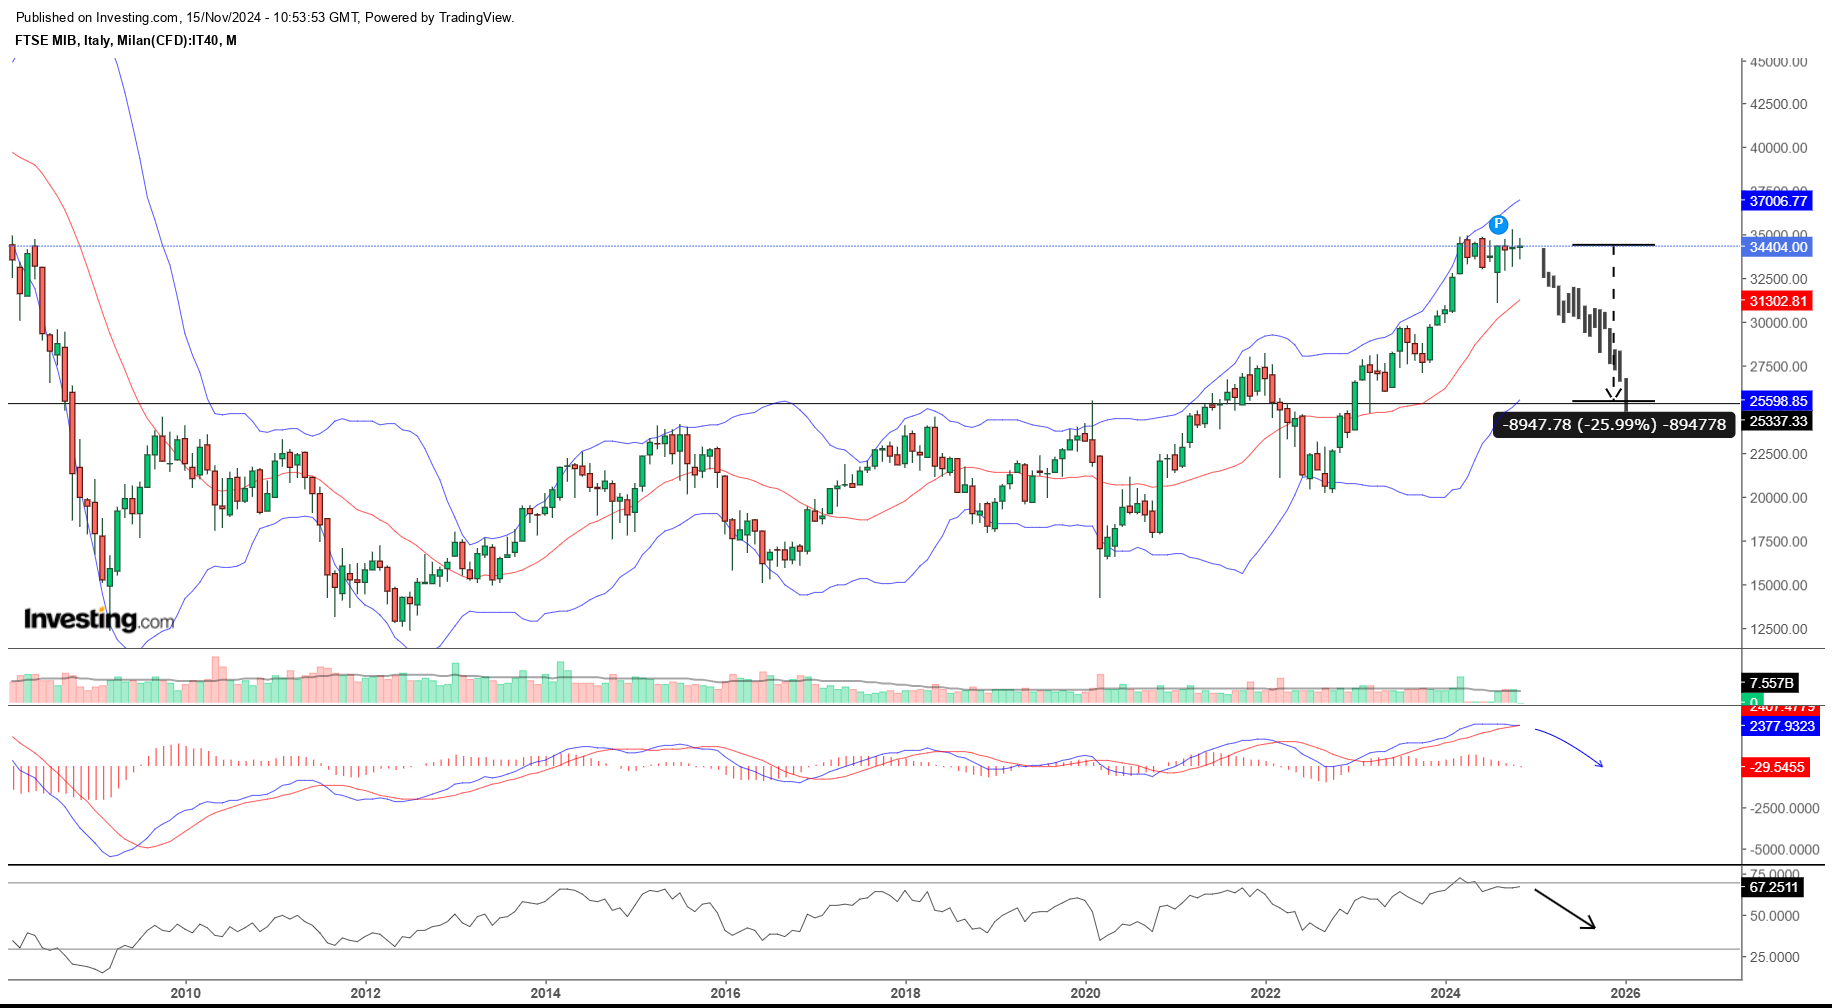
An extensive time-series analysis has been carried over the FTSEMIB to gather statistical parameters and analyse the FTSEMIB daily and cumulative returns volatility patterns. The FTSE MIB chart has already been drifting in a sideways pattern after a BollingerBand technical sell signal that sparked a brief retracement drift. Oscillators in the chart also have been extended on overbought levels and both the MACD and the RSI could be on the cusp of a technical signal of trend reversal in what could be a powerful drift of (26%).


The histogram chart of FTSE MIB returns distribution is of a standard normal, from that volatility statistical inference has been utilised to examine FTSE MIB volatility patterns and clustering in order then to expand on econometrics volatility models as ARCH(1,0,1) and GARCH(1,1). For starters a 21-Days Rolling Volatility has been fitted on its PDF and CDF, giving Normal Distribution Parameters (Mu) 0.0123 and (Sigma) 0.0064 giving a precise estimate of average FTSE MIB returns volatility clustering of 1.23% and sigma 0.64%.


Then, a full time-series chart of 7-day and 21-day annualised Historical volatility has seen in the recent period a spike of the 7-Days Annualised Volatility (16.69%) moving average that has been trailing up the 21-day Annualised Vol (6.78%). These are quantitative analysis technical signals that can help spot, in advance, volatility in markets, and the FTSE MIB could also get volatile and have an overall pullback.


FTSE MIB fruit salad would like AutoCorrelation and Partial AutoCorrelation knockabout and returns have displayed consistent stationarity without any white noise. These are consistent with ACF and PACF stochastic randomness. Compare and contrast the Rolling 21-Days Volatility distribution and the ACF graph displays volatility lag correlation.


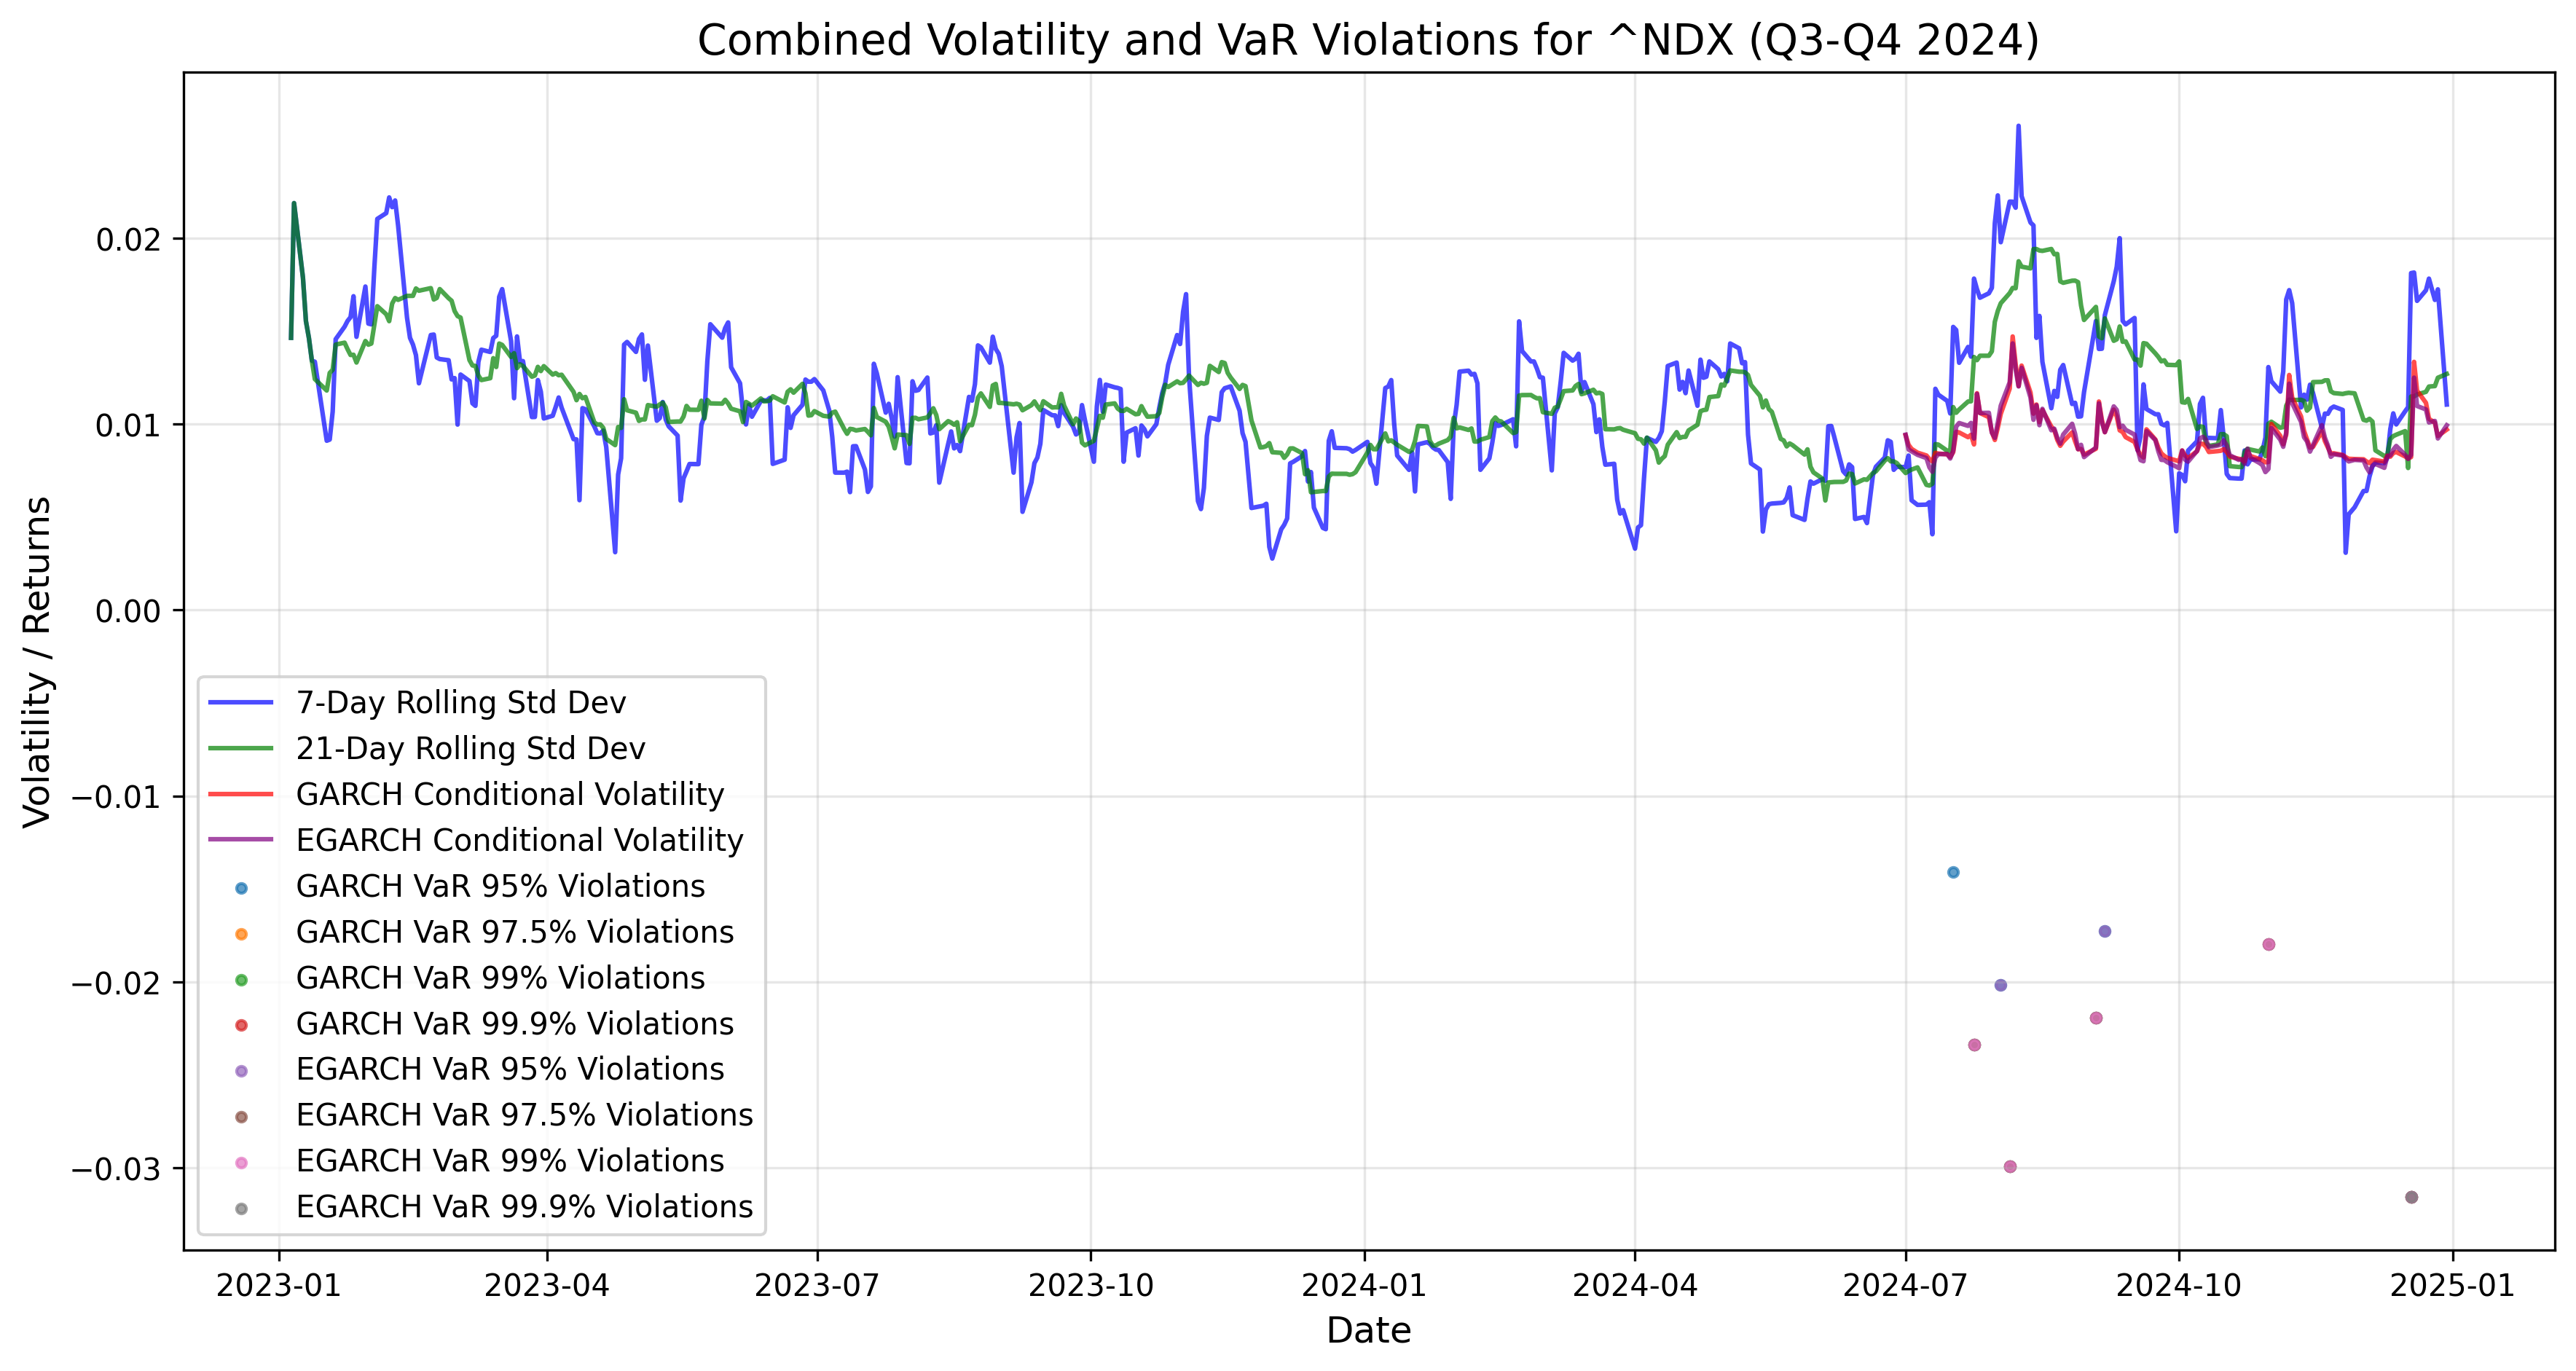
In the graphs below the FTSE MIB returns have been clustered with a 30-Day Rolling Mean and Standard Deviation while also spotting extreme values days to find VaR and extreme volatility patterns. Value at Risk parameters have been extracted based on the FTSE MIB time series, and inferred on the returns clustering graph, highlighting recent periods of violations for daily VaR 95 (-2.13%) and VaR 97.5 (-2.77%)


Confirmation of FTSE MIB’s higher volatility going forward has been observed with a GARCH(1,1) model and high volatility threshold, and it’s possible to see how the GARCH(1,1) model graph brings to attention the recent volatility approaching the high volatility threshold and possibility giving another warning signal to expect higher volatility of the FTSE MIB and wider stock market volatility period. Further down parameters results of FTSE MIB ARCH(1,0,1) and GARCH(1,1) are displayed for completeness, here there’s a simplified concise explanation ARCH model mu=0.000568%, while the Standard Error 2.368e-04 indicates uncertainty in the ARCH estimate, while the t-statistic 2.399 and p-value 1.646e-02 indicate coefficients are statistically significant. Also, the constant term for volatility omega = 1.256e-04 is statistically significant and the Alpha[1] coefficient = 0.350 indicates that 35% of current volatility is explained by the squared returns of the previous periods. Indeed, for the GARCH(1,1) model, we have a mu= 7.3779e-04 higher average returns compared to the ARCH model and the t-statistic 62.115 and p-value 0.00 are both highly significant. Omega coefficient = 3.8653e-06 is a small constant term also highly significant and Alpha[1] =0.10 indicates a 10% inference of current volatility correlated to past squared returns, while the Beta coefficient= 0.88 of lagged volatility indicates that 88% of current volatility is correlated to previous periods of volatility, therefore when volatility spikes in the FTSE MIB higher volatility period can compound the correction of cumulative returns in the FTSEMIB. Overall considerations A lower AIC value indicates a better fit. The GARCH(1,1) model has a lower AIC (-15078.9) compared to the ARCH(1,0,1) model (-14786.0), suggesting that the GARCH model fits the data better, Similarly, the GARCH(1,1) model has a lower BIC (-15055.5), indicating better model performance.
ARCH(1,0,1) Model Summary:
                      Constant Mean - ARCH Model Results
==============================================================================
Dep. Variable:                Returns   R-squared:                       0.000
Mean Model:             Constant Mean   Adj. R-squared:                  0.000
Vol Model:                       ARCH   Log-Likelihood:                7395.99
Distribution:                  Normal   AIC:                          -14786.0
Method:            Maximum Likelihood   BIC:                          -14768.5
                                        No. Observations:                 2515
Date:                Fri, Nov 15 2024   Df Residuals:                     2514
Time:                        09:38:09   Df Model:                            1
                                 Mean Model
============================================================================
                 coef    std err          t      P>|t|      95.0% Conf. Int.
----------------------------------------------------------------------------
mu         5.6803e-04  2.368e-04      2.399  1.646e-02 [1.039e-04,1.032e-03]
                              Volatility Model
============================================================================
                 coef    std err          t      P>|t|      95.0% Conf. Int.
----------------------------------------------------------------------------
omega      1.2562e-04  6.855e-06     18.326  5.089e-75 [1.122e-04,1.391e-04]
alpha[1]       0.3500  6.340e-02      5.520  3.388e-08     [  0.226,  0.474]
============================================================================

Covariance estimator: robust

GARCH(1,1) Model Summary:
                     Constant Mean - GARCH Model Results
==============================================================================
Dep. Variable:                Returns   R-squared:                       0.000
Mean Model:             Constant Mean   Adj. R-squared:                  0.000
Vol Model:                      GARCH   Log-Likelihood:                7543.43
Distribution:                  Normal   AIC:                          -15078.9
Method:            Maximum Likelihood   BIC:                          -15055.5
                                        No. Observations:                 2515
Date:                Fri, Nov 15 2024   Df Residuals:                     2514
Time:                        09:38:09   Df Model:                            1
                                 Mean Model
============================================================================
                 coef    std err          t      P>|t|      95.0% Conf. Int.
----------------------------------------------------------------------------
mu         7.3779e-04  1.188e-05     62.115      0.000 [7.145e-04,7.611e-04]
                              Volatility Model
============================================================================
                 coef    std err          t      P>|t|      95.0% Conf. Int.
----------------------------------------------------------------------------
omega      3.8653e-06  6.730e-12  5.744e+05      0.000 [3.865e-06,3.865e-06]
alpha[1]       0.1000  1.665e-02      6.007  1.889e-09   [6.737e-02,  0.133]
beta[1]        0.8800  1.321e-02     66.612      0.000     [  0.854,  0.906]
============================================================================


