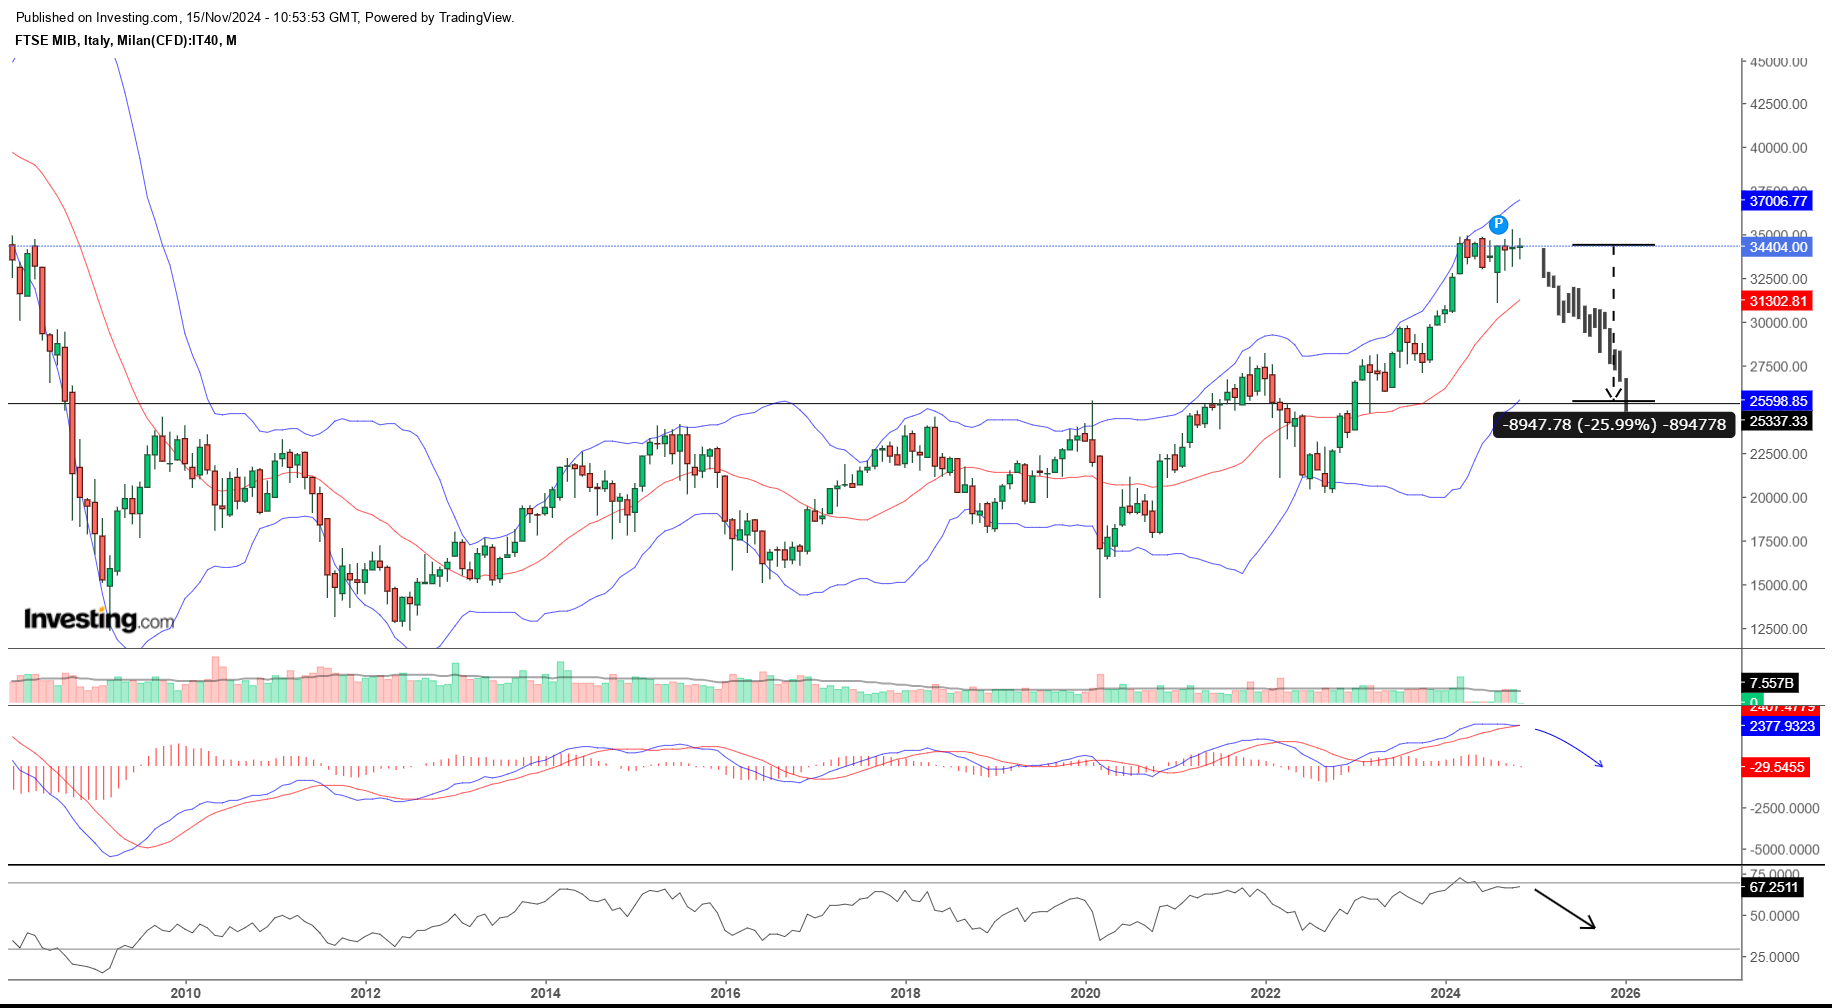
FTSEMIB timeseries volatility study and -26% volatility risk scenario
An extensive time-series analysis has been carried over the FTSEMIB to gather statistical parameters and analyse the FTSEMIB daily and cumulative returns volatility patterns. The FTSE MIB chart has already been drifting in a sideways pattern after a BollingerBand technical…


