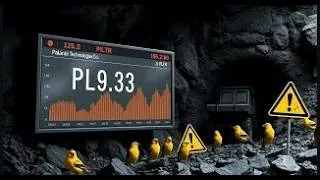
PALANTIR STOCK VOLATILITY: A CANARY IN THE COAL MINE FOR TECH STOCK BUBBLE AND MARKET CORRECTION ?
Palantir Technologies (PLTR) has been one of the most volatile stocks in the technology sector, with its valuation soaring amid speculative enthusiasm. Despite the company’s strong government contracts and AI-driven analytics, its fundamental metrics suggest that the stock may be…

Leverage effect could bring seasonal Q1 stock market drawdown
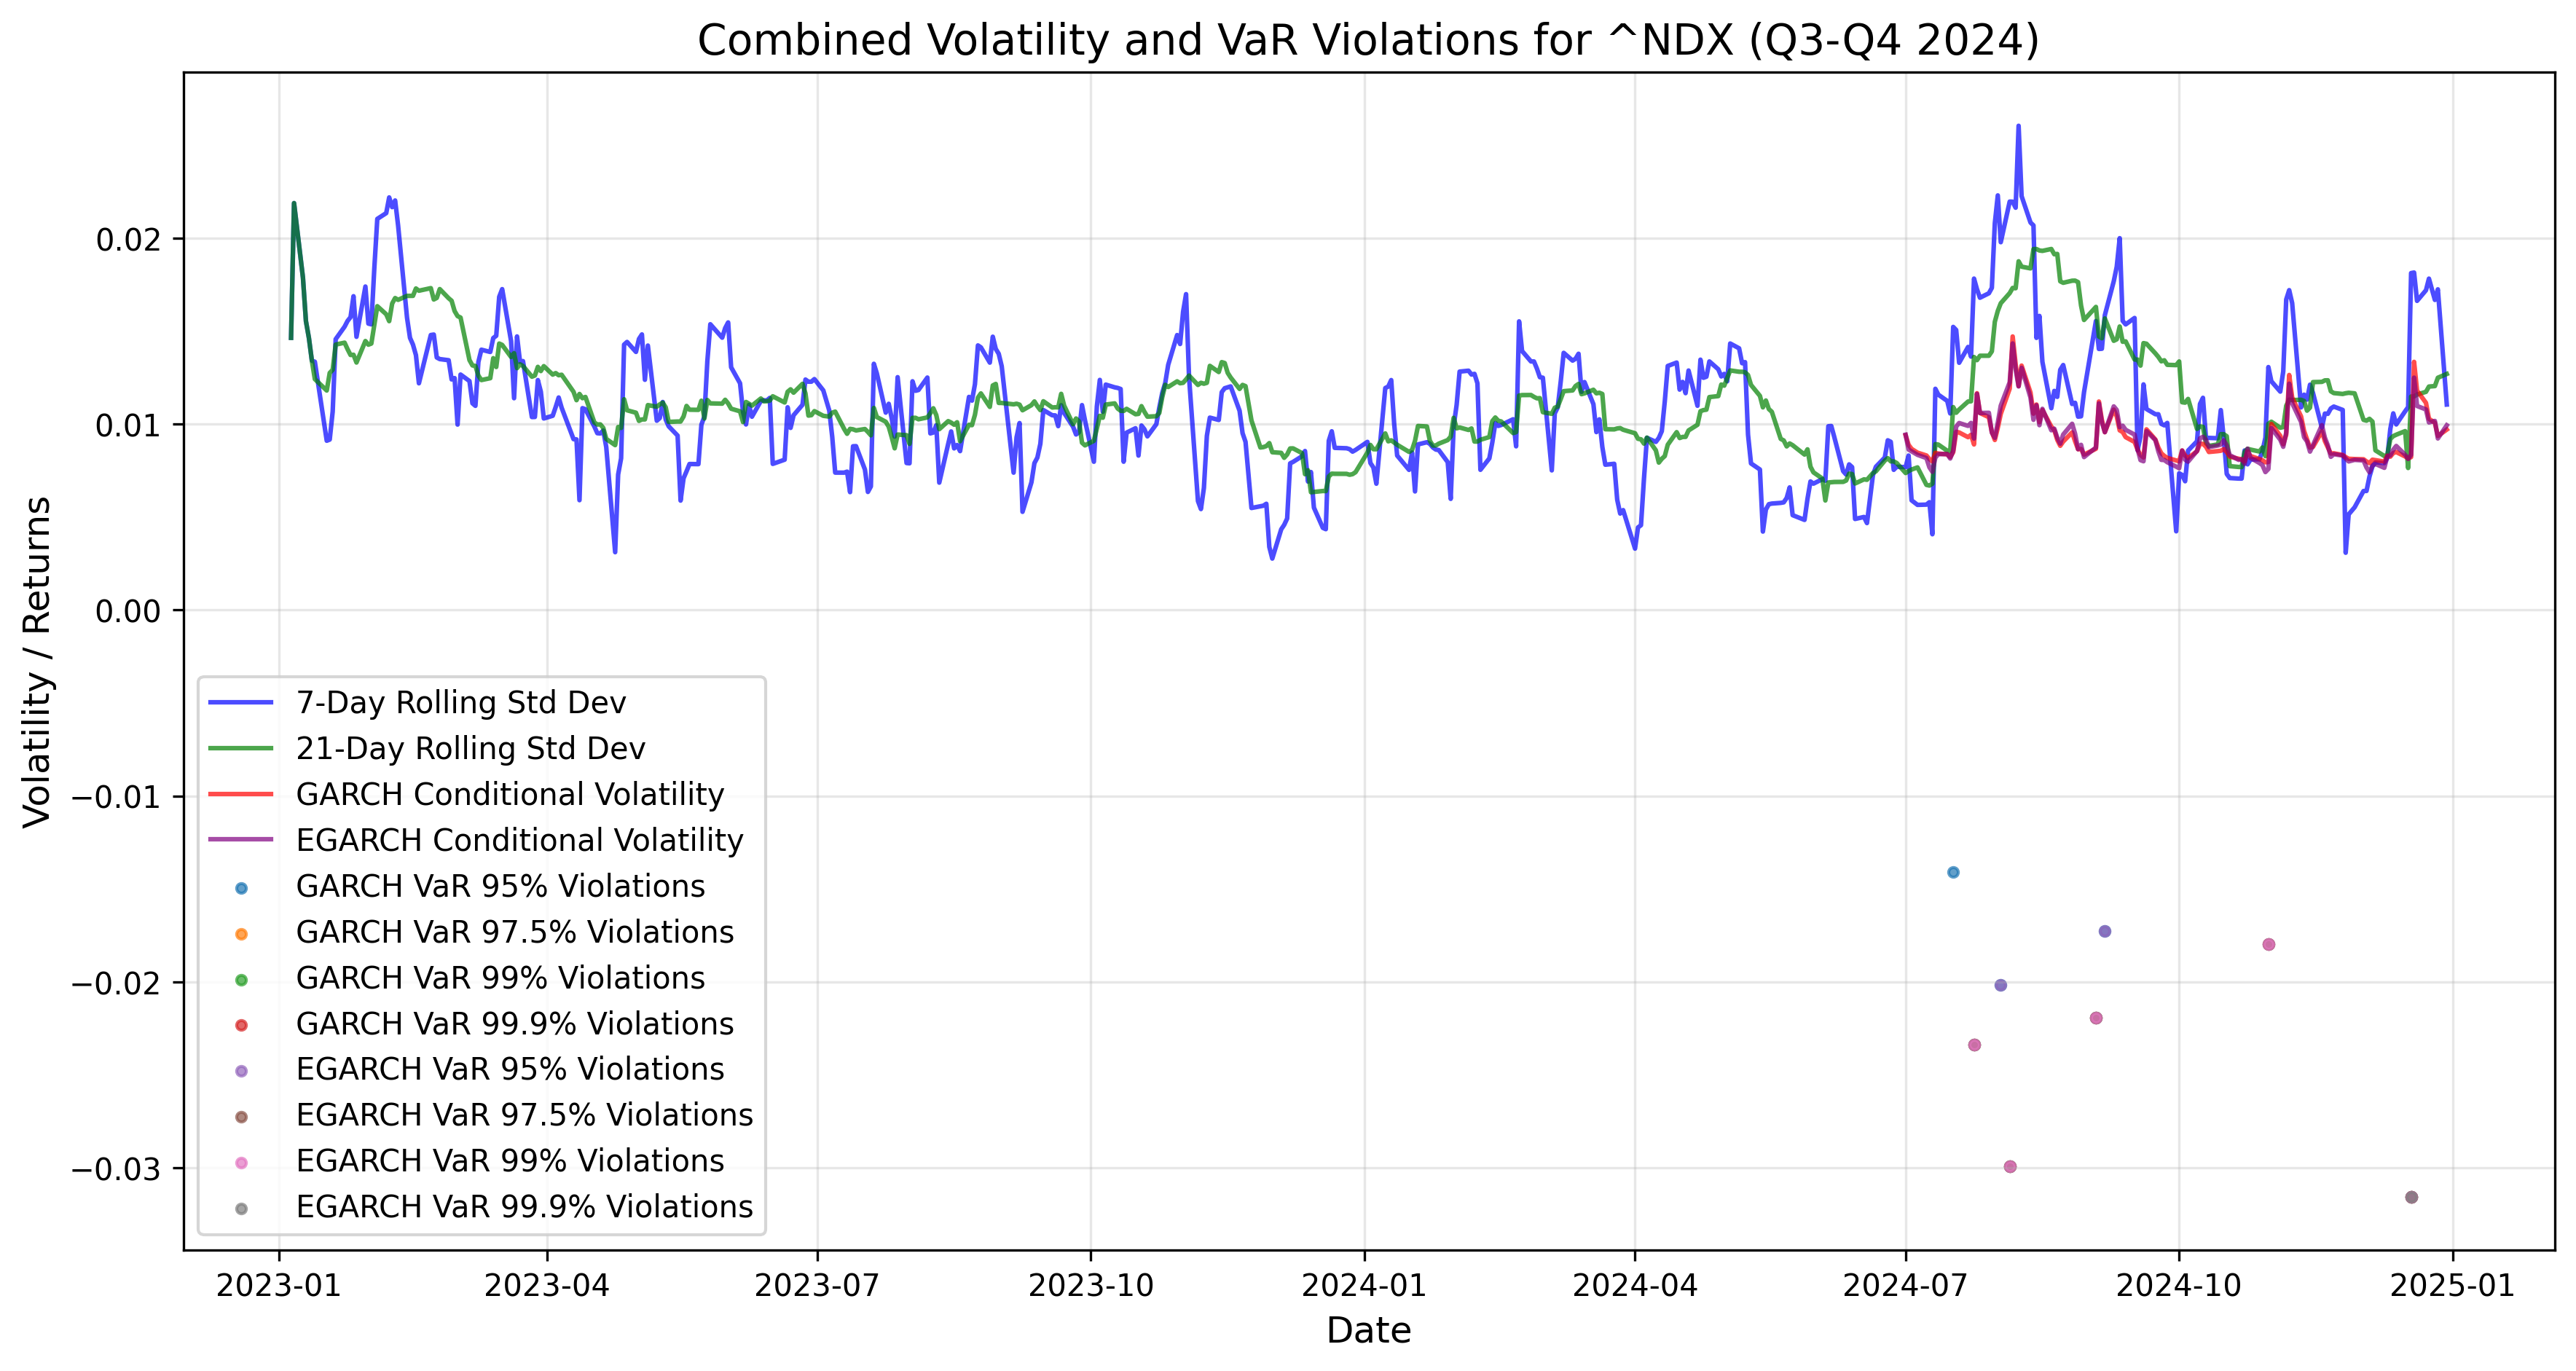
The recent Q4 volatility patterns of the major U.S stock market Index, such as Dow Jones Industrial Average, S&P500, Nasdaq100 and Russell 3000 could have been a forthcoming market signal of a volatility build-up going into Q1 2025, as among…
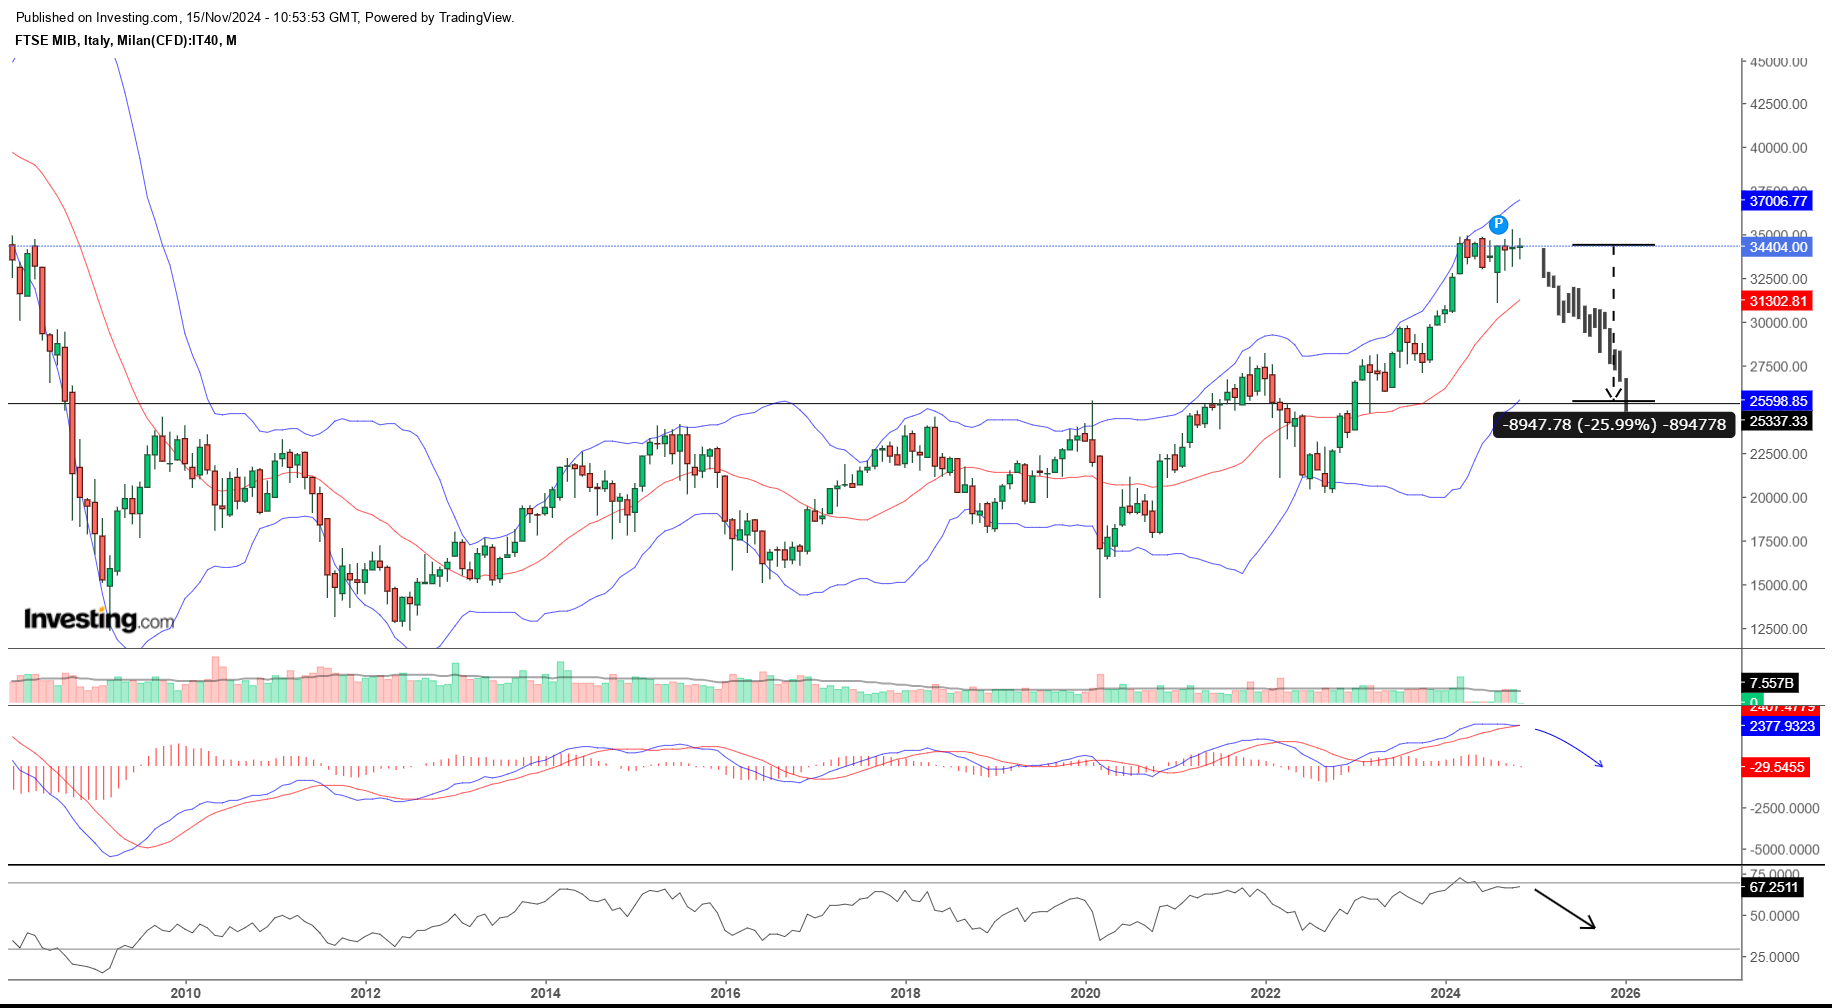
FTSEMIB timeseries volatility study and -26% volatility risk scenario
An extensive time-series analysis has been carried over the FTSEMIB to gather statistical parameters and analyse the FTSEMIB daily and cumulative returns volatility patterns. The FTSE MIB chart has already been drifting in a sideways pattern after a BollingerBand technical…

NASDAQ Halloween Scare and volatility pumpkin spike
As October rolls to its end, markets have their own way of embracing the Halloween spirit, and it seems the NASDAQ-100 (NDX) has chosen a rather spooky route. Traders and investors are beginning to hear the ominous toll of “Hell’s…
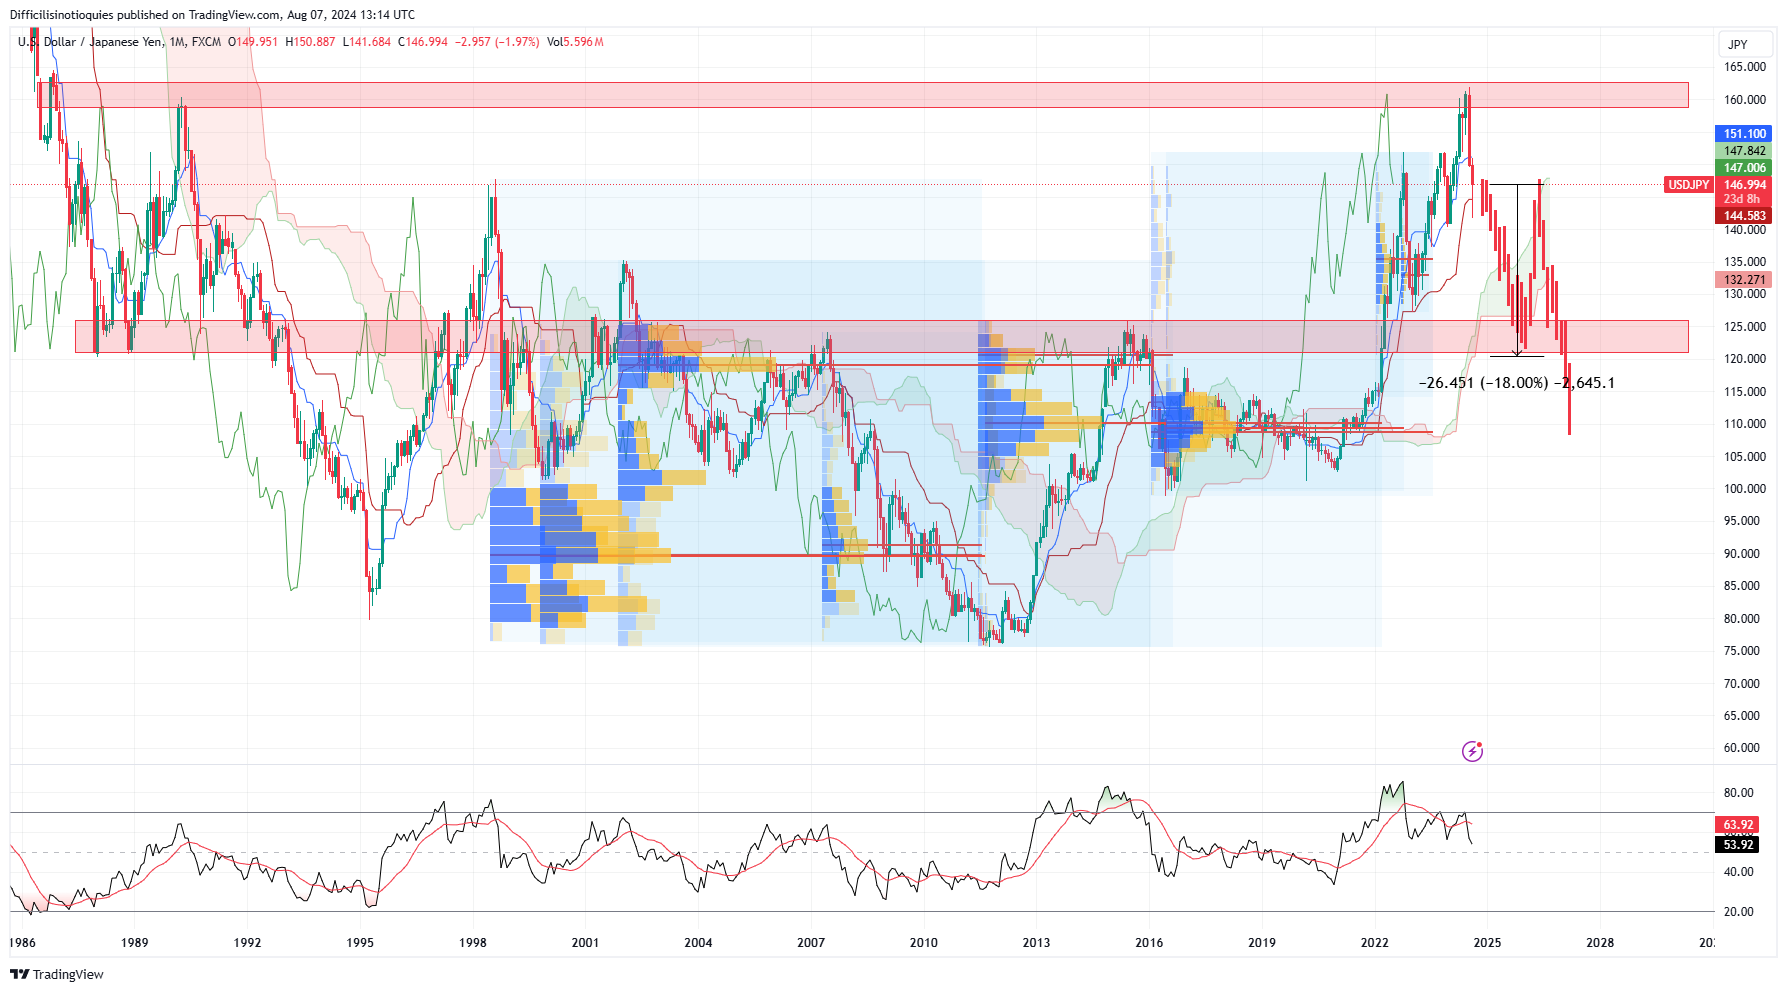
Japan’s debt leverage has been increasing to worrying levels, what could be the implications for the Japanese Yen
Although a very resilient and highly productive and highly technological economy, Japan has achieved many milestones with consistent and somewhat abnormal debt leverage in proportion to the country’s gross domestic product, so the Bank of Japan doesn’t really have anymore…
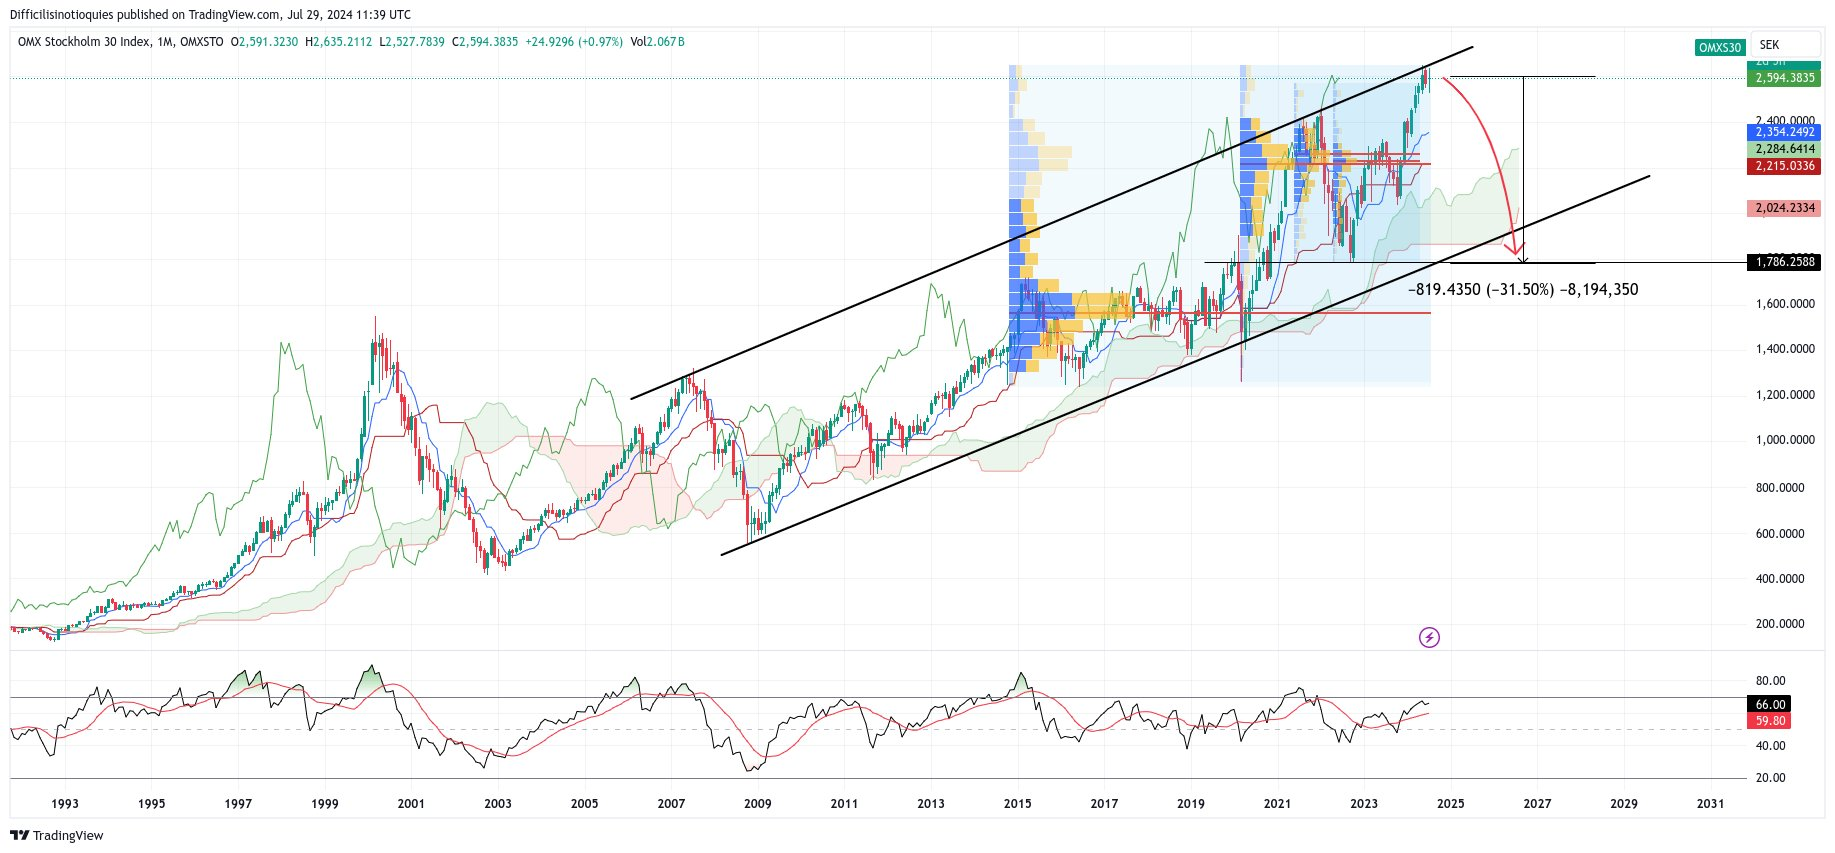
Sweden’s OMSX30 market correction of equities mispricing seems almost inevitable as a hot summer meltdown
Sweden’s economic data confirm early warnings of a Housing Market Debt burst feeding into Economic Recession and Unemployment. Latest data confirm everything foresaw between 2023/24. Sweden’s Unemployment rate increased to 9.4% in June and it’s likely to be in the…
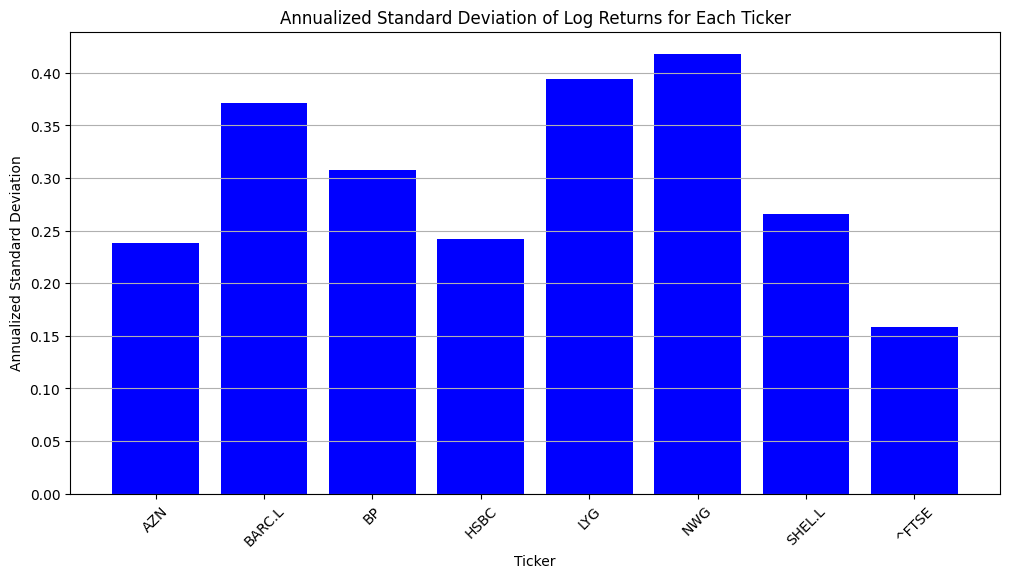
Extracting Market Performance and Volatility Patterns of Blue-Chip Stocks and the FTSE100 Index
Samples of FTSE100 blue chip stocks and the FTSE100 index have been elaborated to understand the stocks’ returns and the index returns since 2010 up to date. A wide variety of descriptive statistics and volatility measures have been assembled, meanwhile,…
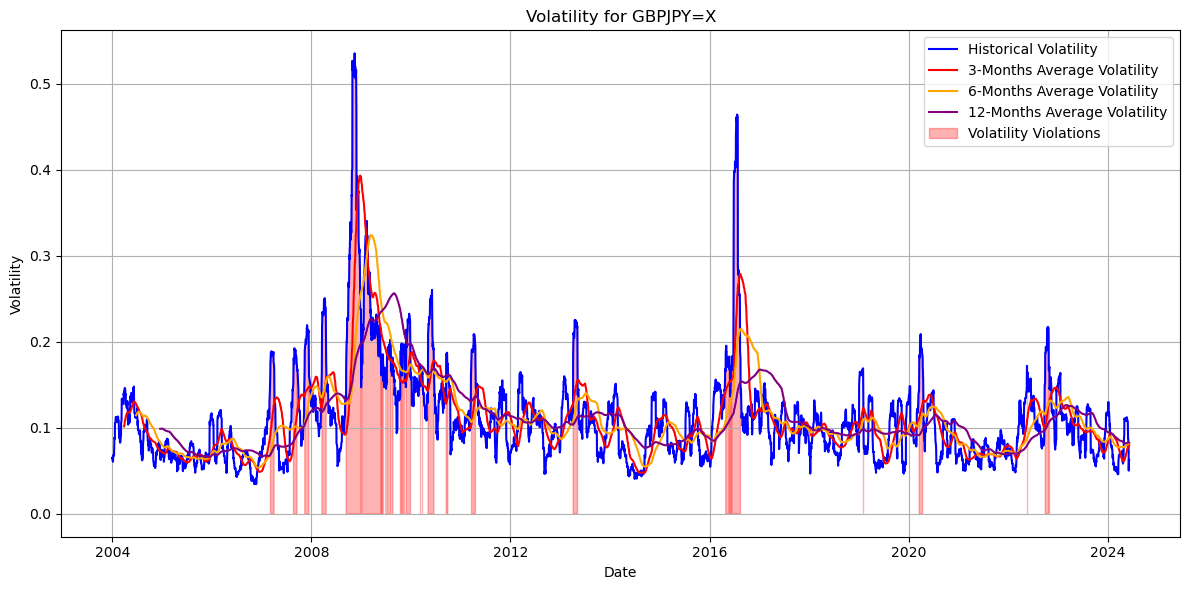
MAJOR POUND STERLING EXCHANGE RATES VOLATILITY STUDY
GBP/CHF, GBP/JPY AND GBP/USD GRAPHS OF HISTORICAL VOLATILITY CALCULATED WITH 30 DAYS STDV OF LOG RETURNS, THEN 3-MONTH, 6-MONTH AND 12-MONTH AVERAGE VOLATILITY. THE GRAPHS OF GBP/CHF, GBP/JPY AND GBP/USD SEE THE 3-MONTH AVERAGE VOLATILITY LINE DRIFTING UPWARD TO CROSS…
THE FTSE100 COULD BE ON THE VERGE OF AN EQUITIES MARKET CORRECTION
The FTSE 100 chart on a monthly time scale has seen the Bollinger Band giving to the FTSE 100 price line a Sell Signal, that has been consolidating on the Tenkan and Kijun Line. However, these are not relevant technical…
The S&P 500 is overvalued and a correction would be natural
A macroeconomic interpretation of the Federal Reserve shrinking its balance sheet could be that q(t)=1+C'{I(t)}, the value of one more unit of capital= cost of getting one more unit of capital, as money markets interest rates rise to match inflation…
S&P 500 POTENTIAL -15% SELL-OFF
SPX price/volume, Daily timescale chart, below the 200-day Exponential Moving Average, that means SPX in logarithmic function. Most important SPX 3963 Point of Control SELL-OFF Signal, with a potential Head&Shoulder candlestick pattern. S&P500 price/volume trendline with a -15% | -17.5%…


