SPX price/volume, Daily timescale chart, below the 200-day Exponential Moving Average, that means SPX in logarithmic function. Most important SPX 3963 Point of Control SELL-OFF Signal, with a potential Head&Shoulder candlestick pattern.
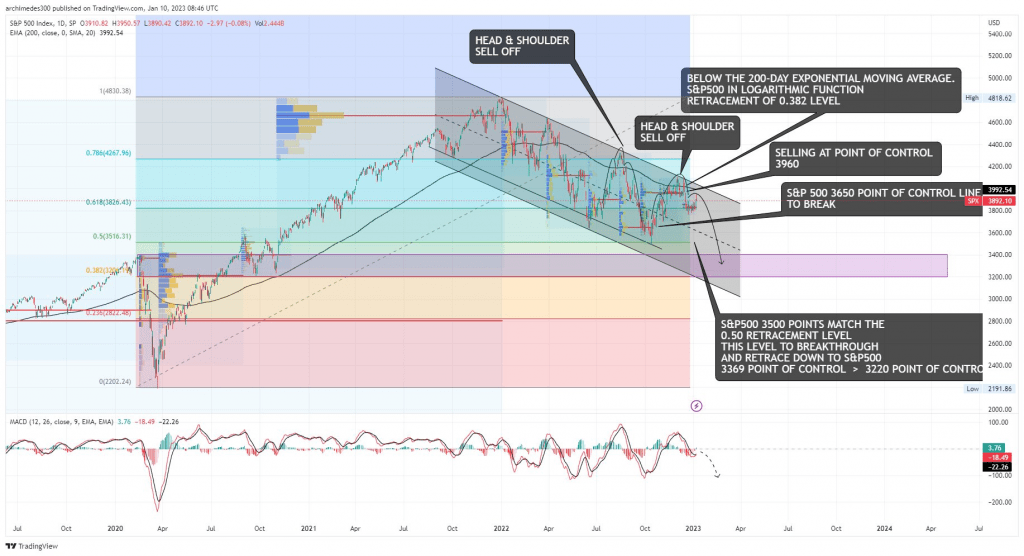
S&P500 price/volume trendline with a -15% | -17.5% sell-off retracement, will breakthrough SPX 3650 Point Of Control, SPX 3500 -> 0.50 retracement level, drifting on 0382 retracement level SPX 3220. Consolidation levels SPX 3400 Point of Control, SPX 3367 | 3200 points of control.
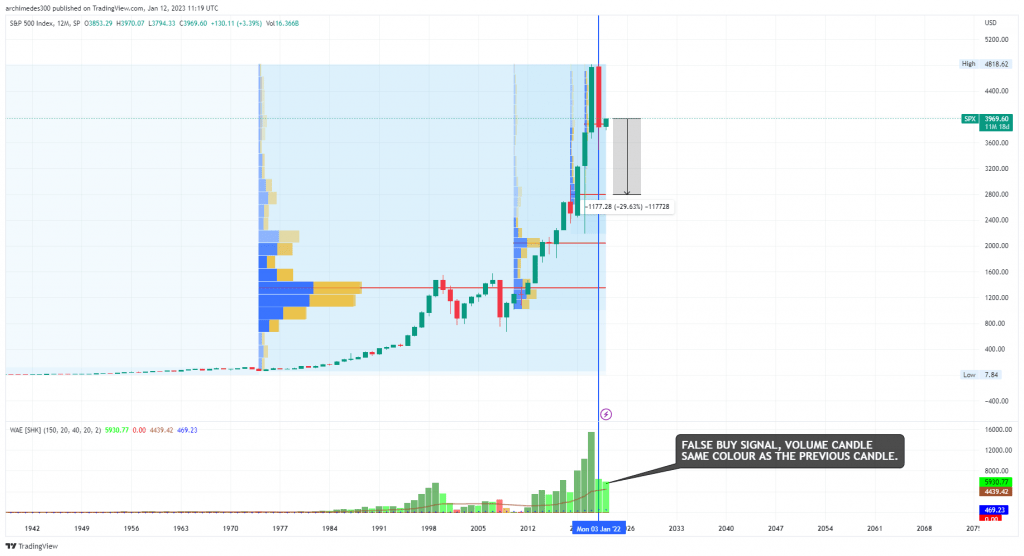
The S&P500 chart on a 12 Months time scale could be providing an important signal with the Volume indicator. The 2022 big red candlestick matched a light green volume, while also the 2023 volume candlestick has the same color as 2022, that could probably mean a false buy signal, that could develop in a -29% correction for the S&P500 drifting lower to the SPX 2787 volume/price point of control.
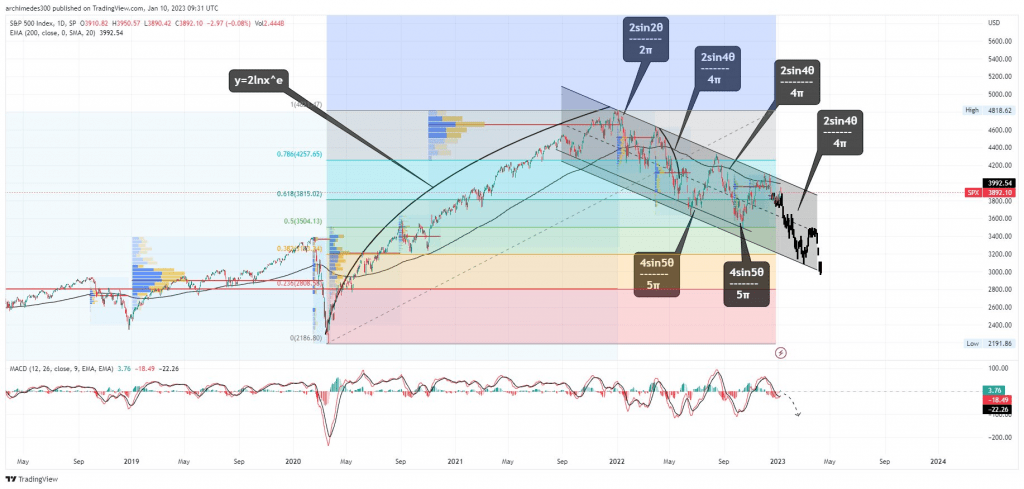
Applied Mathematical natural log function and Fourier Series