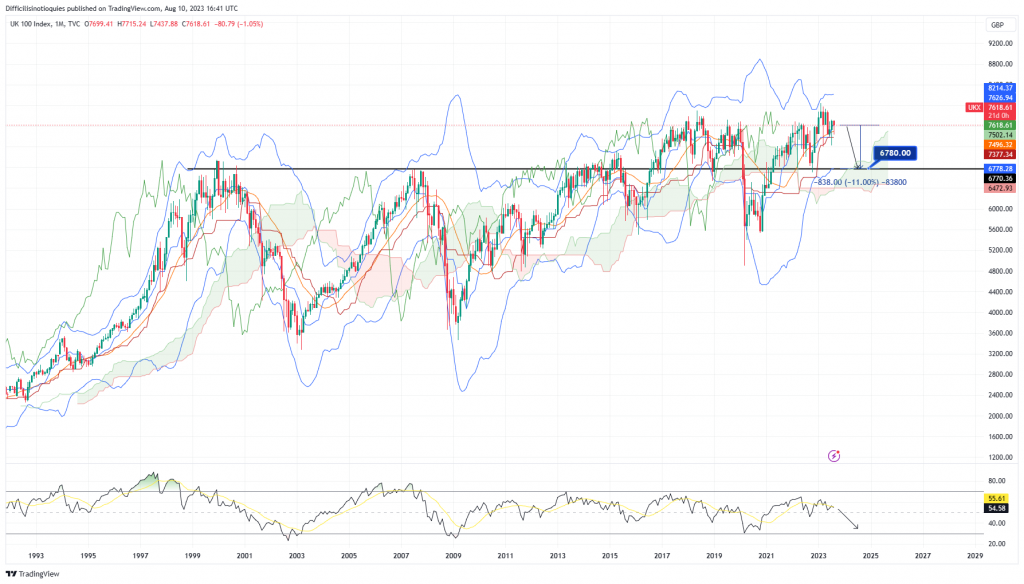
The FTSE 100 chart on a monthly time scale has seen the Bollinger Band giving to the FTSE 100 price line a Sell Signal, that has been consolidating on the Tenkan and Kijun Line. However, these are not relevant technical support areas, therefore the FTSE 100 market could be on the verge of an equities market correction that will see the price line drifting down to the lower edge of the Bollinger Band channel. The RSI Oscillator also seems drifting downward as a signal of the relative weakness of the FTSE 100.