Recent data from the Office for National Statistics (ONS) indicates that UK inflation has been stubbornly persistent, with the Consumer Prices Index (CPI) holding at 3.8% for the third consecutive month in September 2025. This figure, while unchanged, confounded expectations of a rise to 4% and offers a complex picture for policymakers. The Consumer Prices Index including owner occupiers’ housing costs (CPIH), the ONS’s lead measure of inflation, also remained unchanged at 4.1%. Despite being lower than forecasted, inflation has now remained above the Bank of England’s 2% target for 12 consecutive months, presenting a significant challenge for monetary and fiscal policy. This article examines the current inflation dynamics, analyses the underlying drivers, and assesses the prospective path for UK inflation amid evolving economic conditions and policy decisions.
ONS Inflation Picture
The UK’s inflation rate has reached a plateau in recent months. The September CPI figure of 3.8% marks the joint-highest reading since January 2024, when the rate was 4.0%. This represents a significant uptick from the low of 1.7% recorded in September 2024, indicating that the disinflationary process has stalled in the short term. What most contributed to the decline in the CPI index derives from the decrease in Energy prices and Fuel Prices, while Food prices have been steady. The stability in the headline rate in September masks opposing forces beneath the surface. Upward pressure from transport costs was offset by downward contributions from fuel prices and recreation and culture, resulting in a net unchanged figure.
Core Inflation Trends
Core inflation measures, which exclude volatile components like energy, food, alcohol, and tobacco, provide insight into underlying domestic price pressures. Core CPI declined to 3.5% in September 2025, down from 3.6% in August. Core CPIH fell to 3.9% in September, from 4.0% the previous month . The moderate easing in core inflation suggests that underlying price pressures may be gradually moderating, though they remain well above the Bank of England’s 2% target.
Reference Table
| Sector | Annual Inflation Rate (%) | Key Drivers |
|---|---|---|
| Transport | 3.8 | First month-on-month price decline (0.2%) since May 2024; annual rate slowed from 5.1% in August. |
| Food and Non-Alcoholic Beverages | 4.5 | Includes the owner occupiers’ housing costs (OOH) component, which rose by 5.2%. |
| Housing and Household Services | 5.9 | High Inflation, but Slight easing from 5.9% in August. |
| Restaurants and Hotels | 3.9 | High inflation in this sector, though slightly down from 7.5% in August. |
| Alcohol and Tobacco | 5.8 | Part of persistent services inflation; the rate increased from 3.8% in August . |
| Recreation and Culture | 2.7 | Downward pressure, notably from live music tickets (monthly prices down 8.6%) . |
| Education | 7.2 | High inflation, but increased from 0.2% in August. |
| Clothing and Footwear | 0.5 | Low inflation, easing from 0.8% in August. |
| Furniture and Household Goods | 0.4 | Part of persistent services inflation; the rate increased from 3.8% in August. |
| Communication | 4.7 | The rate decreased from 6.1% in August. |
| Miscellaneous Goods and Services | 2.0 | Upward effects from motor fuels, air fares, and vehicle maintenance and repair. |
Cost-Push Price pressures are an idiosyncratic feature of the UK economy and the highest cost for any ordinary consumer have been evident since a long time, such as: Food Inflation 4.5%, Housing Costs 5.2%, Hounsing and Household Services 5.9%, Communication Utilities 4.7%, Education 7.2%, Health Services 3.5%, and the broader CPIH Index for Services 4.9% still reads above the Bank of England bank rate and ways aways from the price stability aim of 2%. The idiosyncratic features of advanced economies based on services, asset prices inflation and consumer demand without production, are the typical cost-push factors linked to wider strained supply-chains, and the typical inelasticity and slow pace of Business adjustments to prices, which make Inflation Expectations embedded and structurally higher for the whole economy.
Upstream Pipeline Pressures
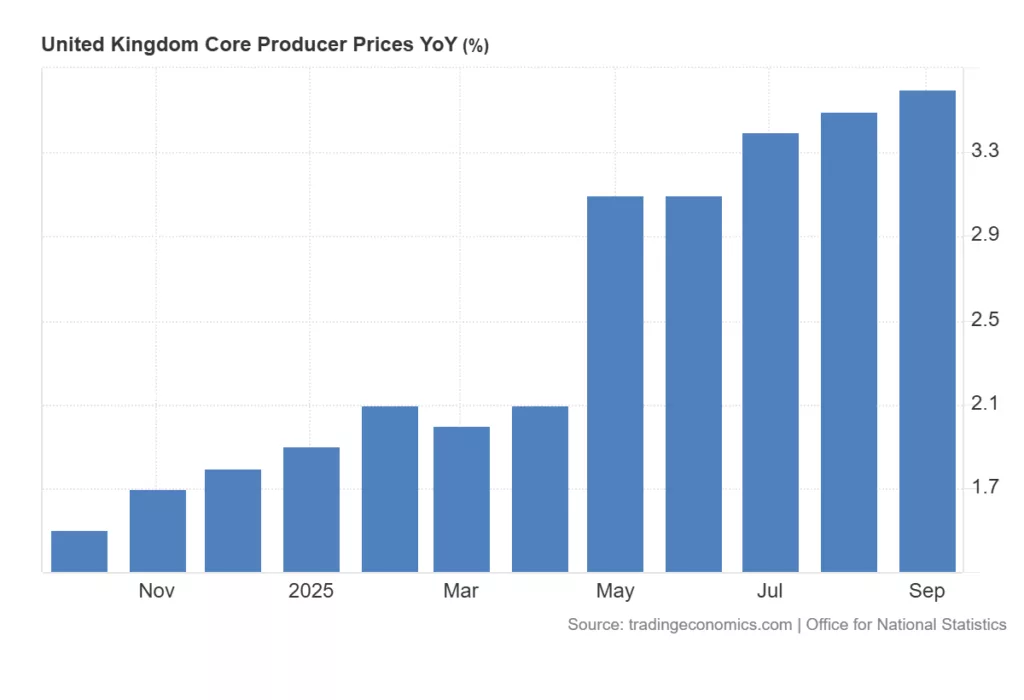
Pipeline pressures in the production sector present a concerning signal for future consumer inflation: Producer output prices (factory gate prices) rose by 3.4% in the year to September 2025, up from 3.1% in August. Core Producer Prices also increased to 3.6%, both input factors of future Inflation Expectations to be managed.
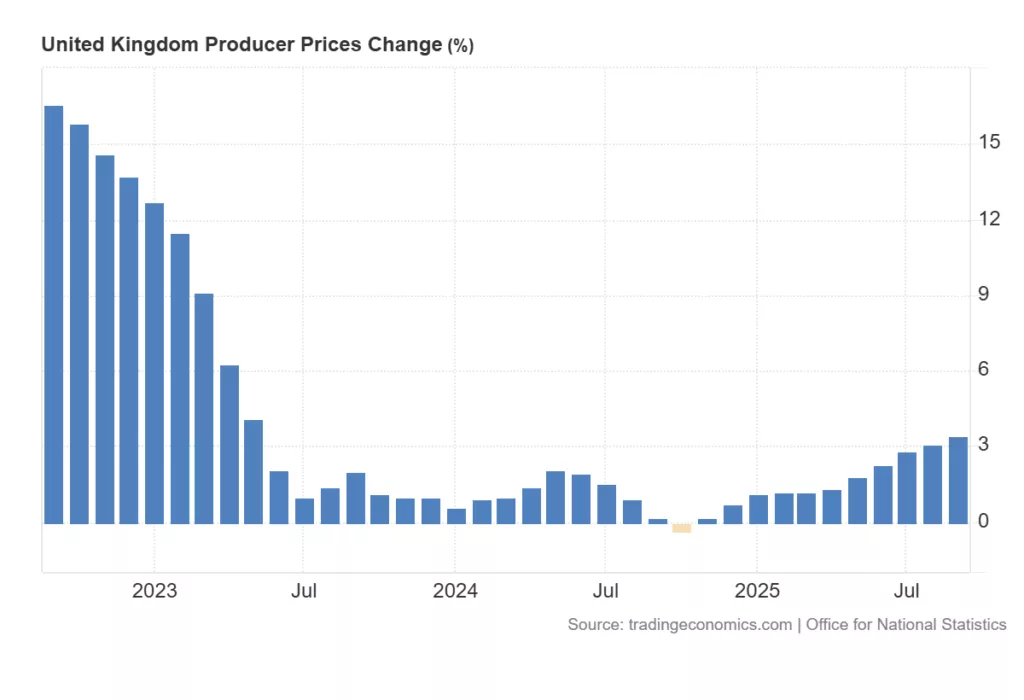
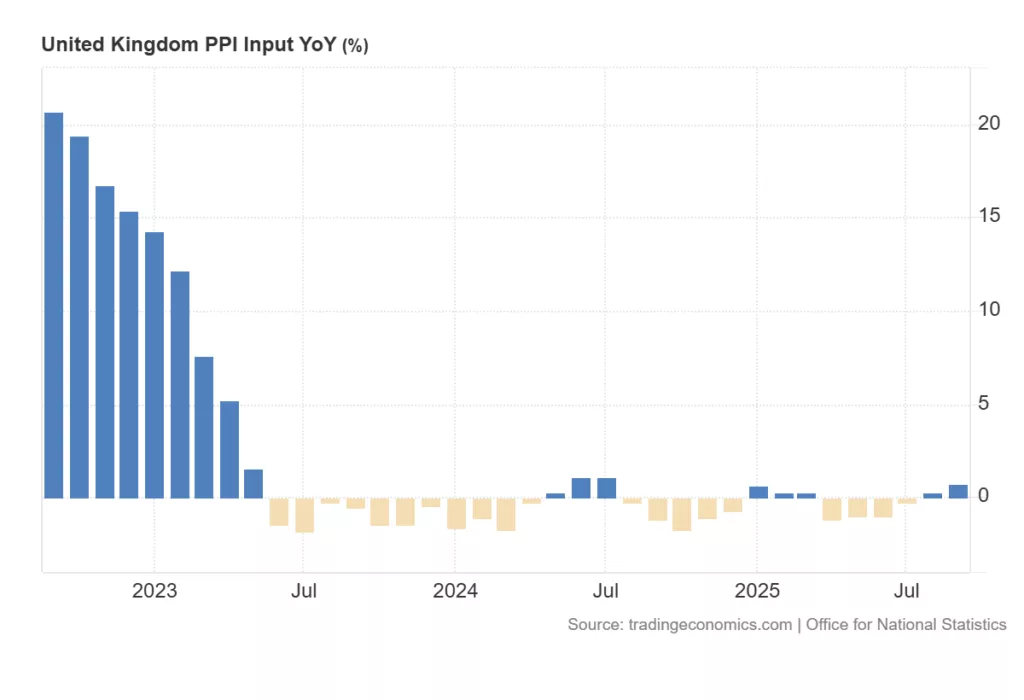
The biggest jump has been the Producer input prices monthly data showing increases of 0.8% over the same period, accelerating from 0.2% in August, although this can be taken as one-off volatile monthly data reading; nevertheless, the Input cost have to be monitored for Inflation Expectations . The acceleration in both input and output prices suggests that cost pressures remain embedded in the production pipeline, which could filter through to consumer prices in the coming months.
Near-Term Projections Provided by our 6-Month Forecast
Most economists believe that inflation likely peaked in September and should begin a gradual descent in the coming months. The Bank of England expects inflation to “fall back thereafter towards the 2% target,” though it remains alert to risks that could disrupt this path. Looking further ahead, the Institute for Fiscal Studies projects that “headline CPI inflation should drop back to target in the first half of next year as the effect of the tax changes announced in last October’s Budget drops out of the calculation”. Their forecast assumes that Bank Rate will continue to fall, reaching 3.5% in the first half of 2026, which should support a cyclical rebound in economic activity.
UK Inflation Outlook: Model Performance and Future Trajectory
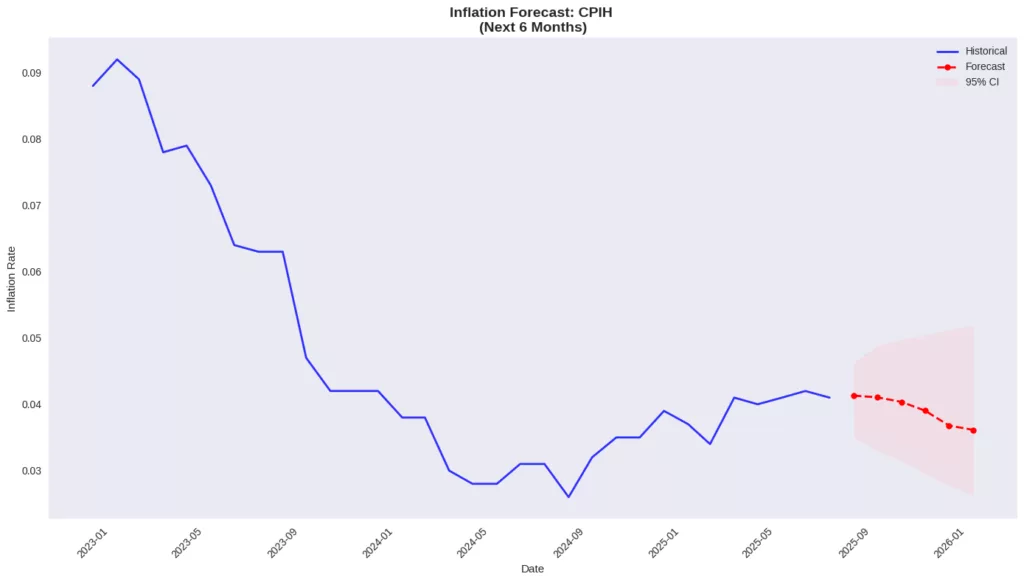
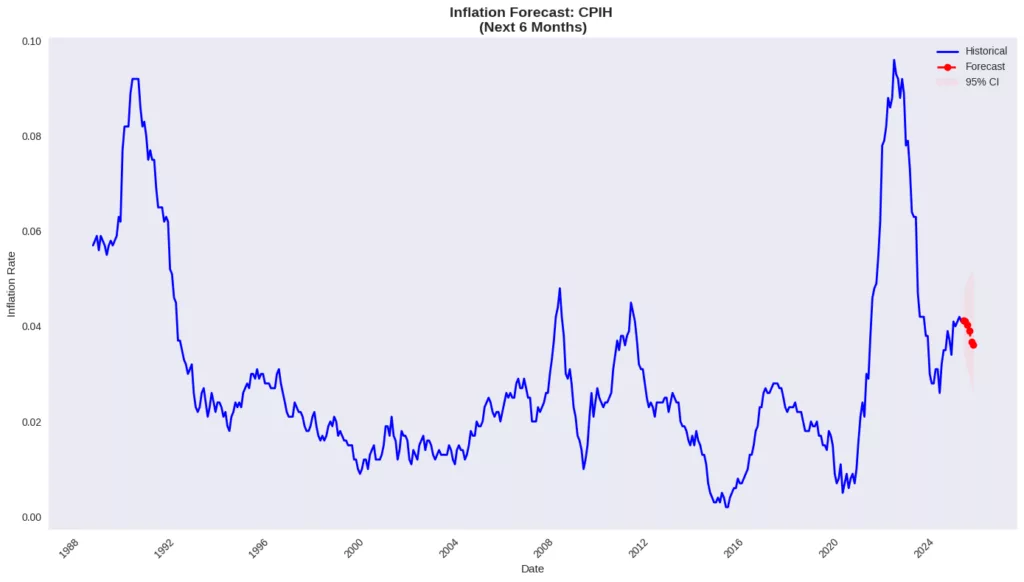
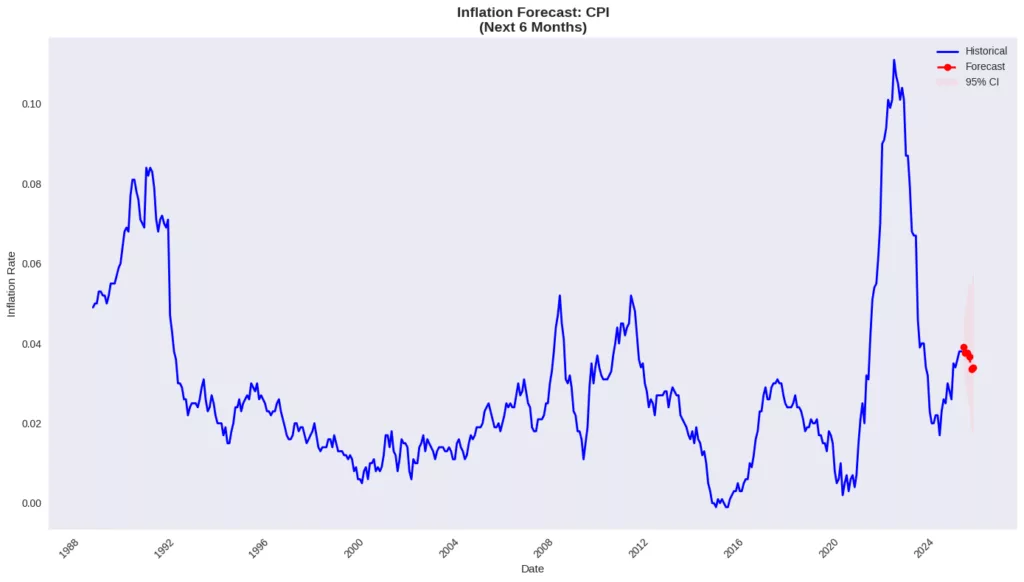
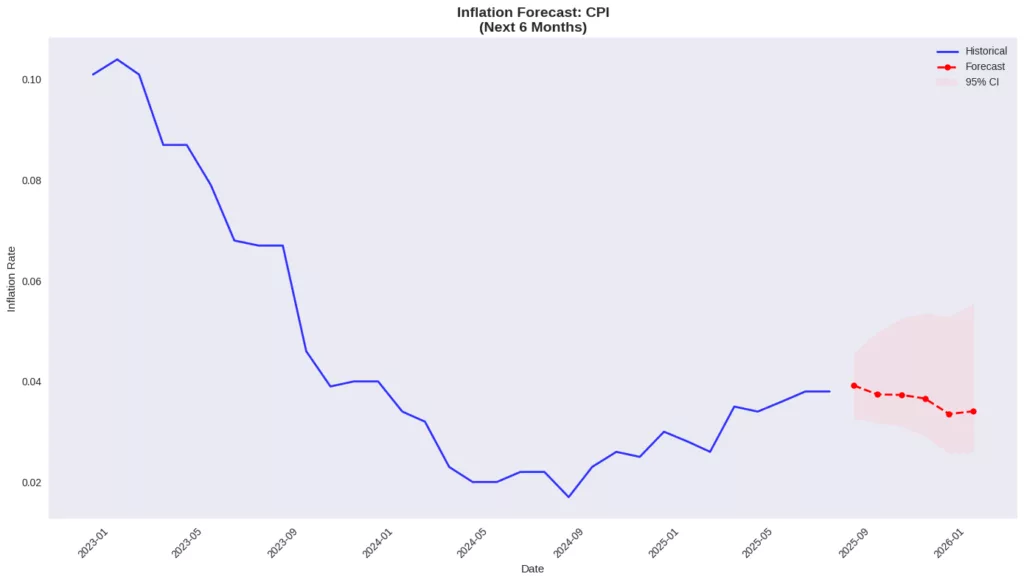
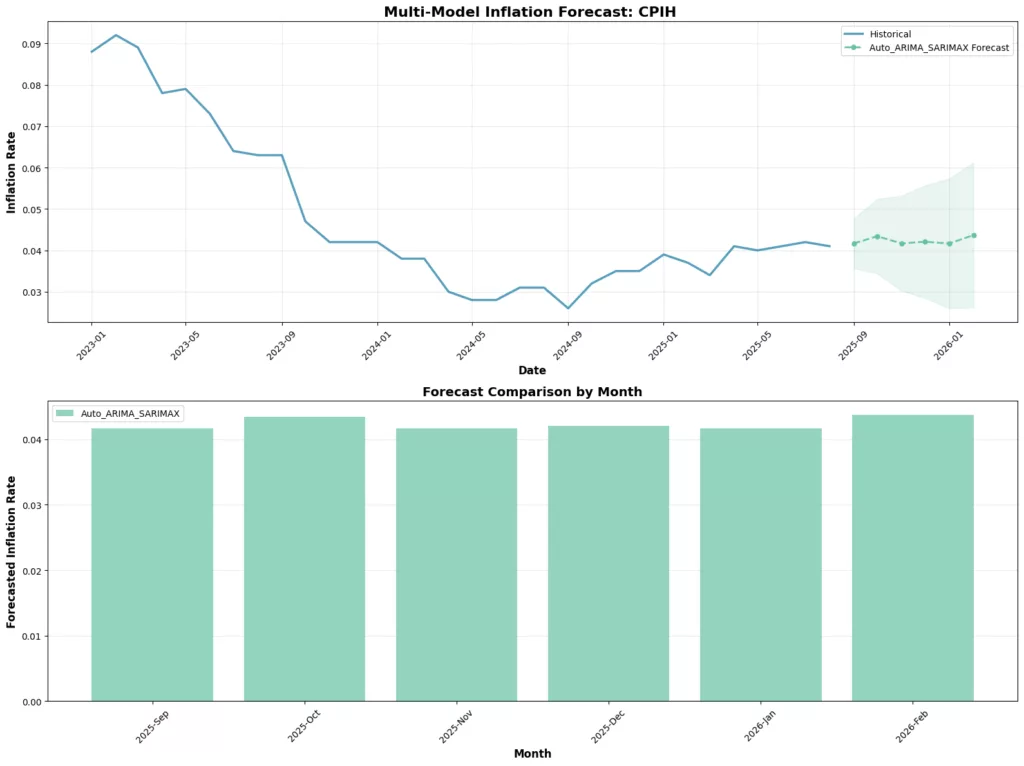
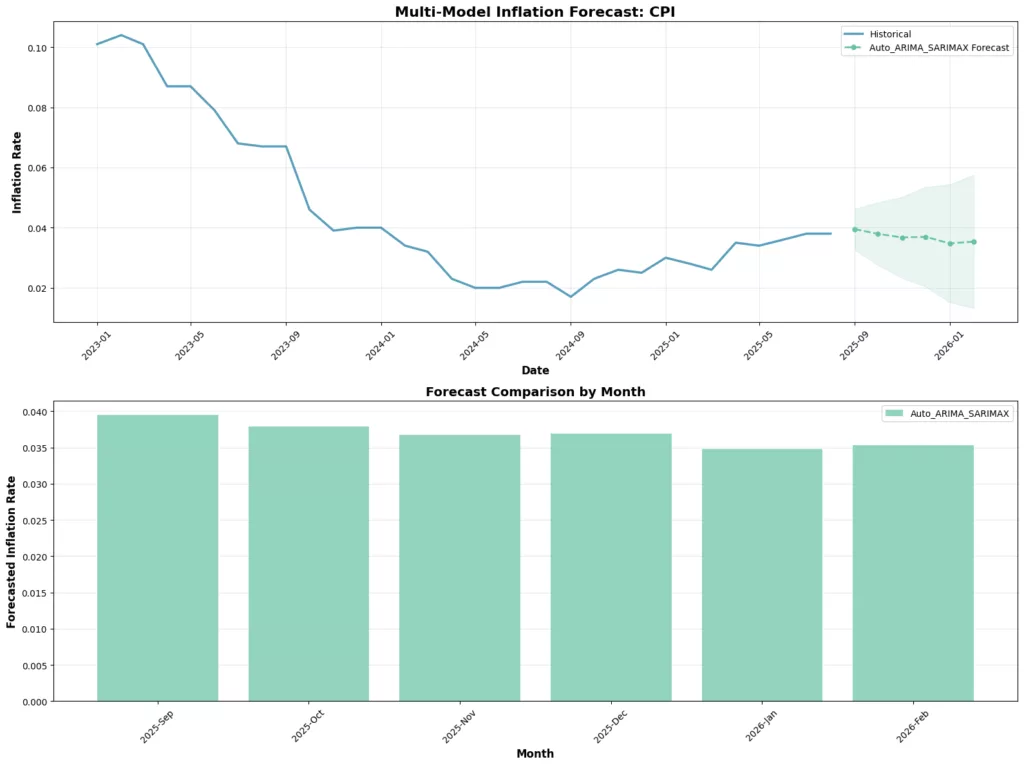
Our time series analysis demonstrates robust predictive accuracy across key UK inflation measures, with ARIMA models achieving exceptional forecast performance for headline inflation indicators. The CPIH model delivered outstanding results with a mere 6.08% MAPE and RMSE of 0.00267, while CPI and RPI models showed strong predictive power with MAPEs of 11.43% and 14.79% respectively. The forecasting accuracy is particularly noteworthy given the complex seasonal patterns captured by the optimal ARIMA specifications: CPIH (5,0,2)(0,0,2)[12], CPI (3,0,0)(1,0,2)[12], and RPI (2,0,2)(0,0,1)[12]. Looking ahead, the models project a gradual disinflationary path through early 2026, with CPIH expected to decline from 4.13% in September 2025 to 3.61% by February 2026, while CPI shows a similar moderating trend from 3.92% to 3.41% over the same period. However, RPI is forecast to remain elevated around 5.0-5.2%, reflecting persistent housing and cost-of-living pressures. The exceptionally wide confidence intervals for RPI forecasts, spanning up to 5.7 percentage points by February 2026, highlight significant uncertainty in the retail price trajectory. Core inflation measures show more muted but stable projections, with CPIH core maintaining a 0.2-0.5% range, suggesting that underlying inflationary pressures are becoming more anchored. The overall outlook suggests a feasible return toward target inflation by mid-2026, though the path remains contingent on energy price stability and services inflation moderation.
CPIH 6-Month Forecast Trajectory
| Date | Forecast | Lower CI | Upper CI |
|---|---|---|---|
| 2025-Sep | 4.13% | 3.51% | 4.62% |
| 2025-Oct | 4.10% | 3.30% | 4.88% |
| 2025-Nov | 4.04% | 3.15% | 4.97% |
| 2025-Dec | 3.90% | 2.96% | 5.04% |
| 2026-Jan | 3.68% | 2.78% | 5.11% |
CPI 6-Month Forecast Trajectory
| Date | Forecast | Lower CI | Upper CI |
|---|---|---|---|
| 2025-Sep | 3.92% | 3.27% | 4.56% |
| 2025-Oct | 3.74% | 3.18% | 4.97% |
| 2025-Nov | 3.73% | 3.11% | 5.25% |
| 2025-Dec | 3.66% | 2.91% | 5.35% |
| 2026-Jan | 3.35% | 2.57% | 5.28% |
| 2026-Feb | 3.41% | 2.60% | 5.54% |
Multi-Model Inflation Forecast
Indeed, optimised ARIMA-SARIMAX models have been implemented with a priori stationarity, which have yielded enhanced forecasting precision and more robust parameter specifications for the UK Inflation measure and its possible future path.
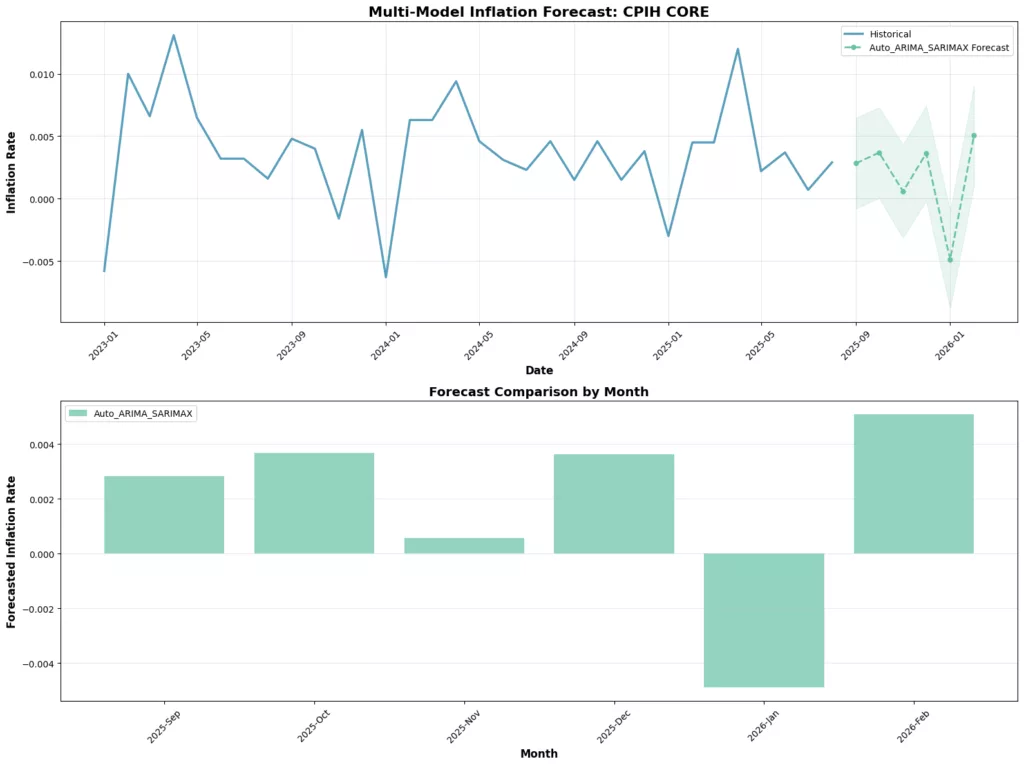
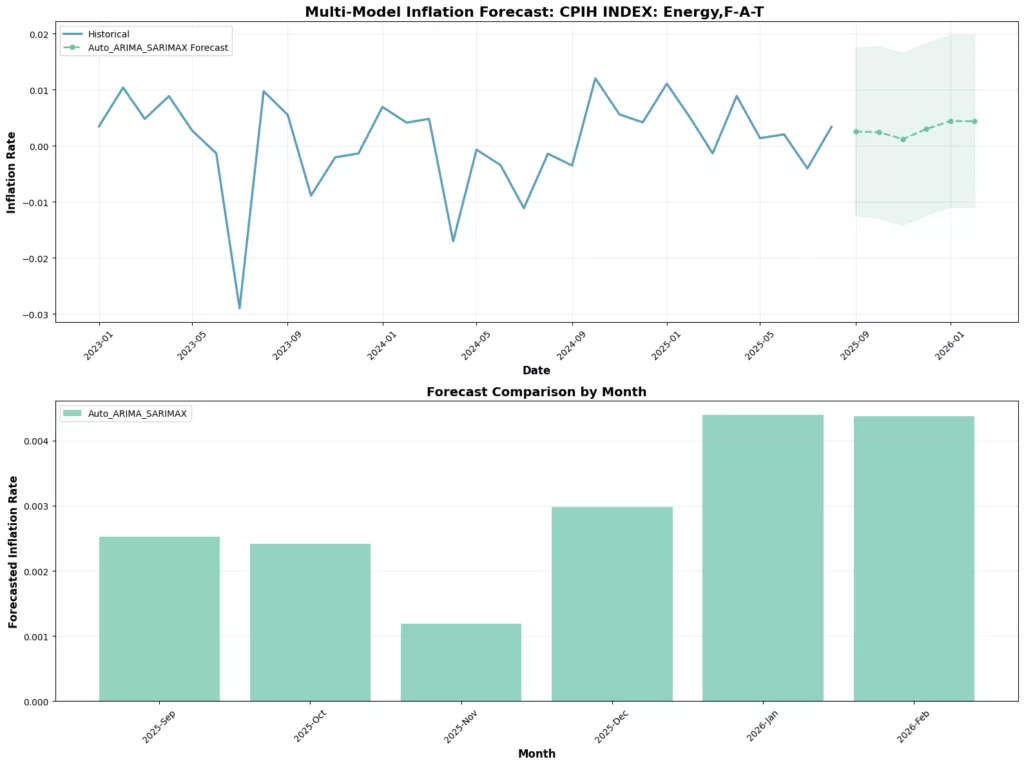
Energy and Core Inflation Analysis: Divergent Trajectories with Critical Policy Implications
The energy and core inflation components reveal strikingly divergent patterns that carry significant implications for monetary policy. The CPIH Energy, Food, Alcohol, and Tobacco (F-A-T) index demonstrates remarkable stability, with the optimised ARIMA(0,0,1)×(0,1,1,12) model forecasting a consistently muted trajectory around 0.2-0.4% through early 2026. This persistent low volatility, evident in the narrow 0.3% range across the forecast horizon, reflects well-anchored energy and commodity price expectations, though the substantial confidence intervals (±1.5 percentage points) underscore ongoing uncertainty in global energy markets. In stark contrast, core inflation (excluding energy, food, alcohol, and tobacco) exhibits greater dynamism, requiring first-difference stationarity enforcement in the ARIMA(0,1,2)×(0,1,1,12) specification. The core forecasts reveal a volatile path with notable swings, including a concerning -0.49% deflationary dip in January 2026, followed by a sharp rebound to 0.51% in February. This whipsaw pattern, coupled with much tighter confidence intervals (±0.4 percentage points), suggests underlying domestic price pressures remain unsettled despite the overall disinflationary trend. The divergence between stable F-A-T components and volatile core measures highlights the complex challenge facing policymakers: while headline inflation may moderate, persistent core volatility indicates ongoing domestic inflationary pressures that could complicate the path to sustained price stability.
Comprehensive UK Inflation Forecast Performance & Outlook Summary
| Measure | Model Performance | 6-Month Forecast Trend | Key Risk Assessment | Policy Priority |
|---|---|---|---|---|
| CPIH | Excellent (MAPE: 6.08%) | Gradual decline: 4.13% → 3.61% | Moderate (CI width: 2.6pp) | High – Primary target |
| CPI | Very Good (MAPE: 11.43%) | Moderate decline: 3.92% → 3.41% | Elevated (CI width: 2.9pp) | High – Headline measure |
| RPI | Good (MAPE: 14.79%) | Persistent elevation: ~5.0-5.2% | High (CI width: 5.7pp) | Medium – Cost of living |
| CPIH SERVICES | Poor (MAPE: 96.46%) | Volatile: -0.15% to 0.45% | Critical (Non-stationary) | High – Persistence risk |
| RPI FOOD | Poor (MAPE: 105.65%) | Stable low: 0.11% to 0.45% | Extreme (CI width: 4.4pp) | Medium – Volatility |
| ENERGY F-A-T | Very Poor (MAPE: 150.30%) | Muted: 0.10% to 1.00% | High (Global uncertainty) | High – External shock risk |
| CPIH CORE | Moderate (MAPE: 49.27%) | Volatile: -0.33% to 0.51% | Critical (Non-stationary) | Highest – Underlying pressure |
Forecast Confidence & Model Reliability Assessment
| Measure | Model Reliability | Confidence Band Analysis | Stationarity Status | Economic Interpretation |
|---|---|---|---|---|
| CPIH | ⭐⭐⭐⭐⭐ | Narrow (2.6pp) | Stationary | Most reliable – Clear disinflation |
| CPI | ⭐⭐⭐⭐ | Moderate (2.9pp) | Stationary | Reliable – Gradual moderation |
| RPI | ⭐⭐⭐ | Very Wide (5.7pp) | Stationary | Uncertain – Housing cost volatility |
| CPIH SERVICES | ⭐⭐ | Narrow (1.0pp) | Non-stationary | Concerning – Services persistence |
| RPI FOOD | ⭐ | Extreme (4.4pp) | Stationary | Unreliable – High food volatility |
| ENERGY F-A-T | ⭐ | Wide (3.1pp) | Stationary | High risk – Geopolitical exposure |
| CPIH CORE | ⭐⭐ | Narrow (1.0pp) | Non-stationary | Critical – Underlying pressure uncertainty |
Enhanced Inflation Conditional Volatility Models, Quality Data
GARCH Volatility Persistence Regime Classification
| Volatility Regime | Persistence Range | Half-Life | Key Series | Policy Implication |
|---|---|---|---|---|
| Near-Unit Root | 0.99-1.00 | 30+ periods | CPI, RPI Food | Severe persistence – shocks have permanent effects |
| Very Persistent | 0.95-0.99 | 13-30 periods | CPIH, RPI, Energy | Long-lasting effects – extended volatility cycles |
| Moderately Persistent | 0.70-0.95 | 2-13 periods | CPIH Core | Manageable persistence – moderate mean reversion |
| Low Persistence | 0.00-0.70 | <2 periods | CPIH Services | Rapid decay – quick volatility normalisation |
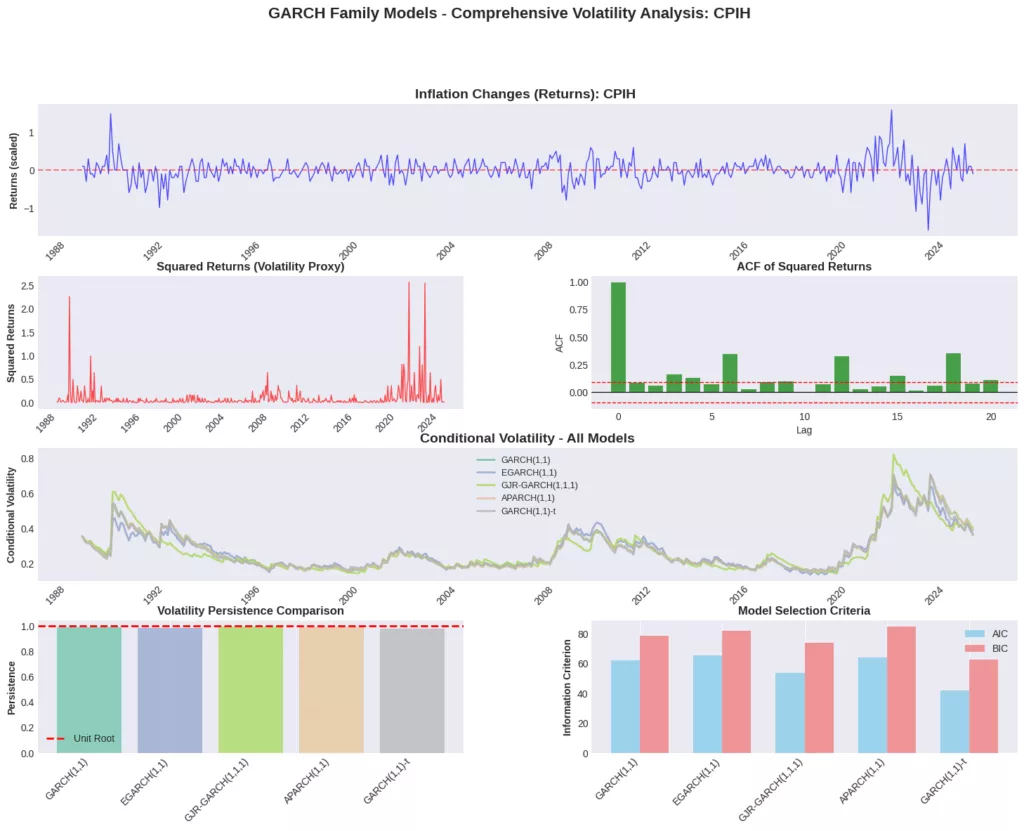
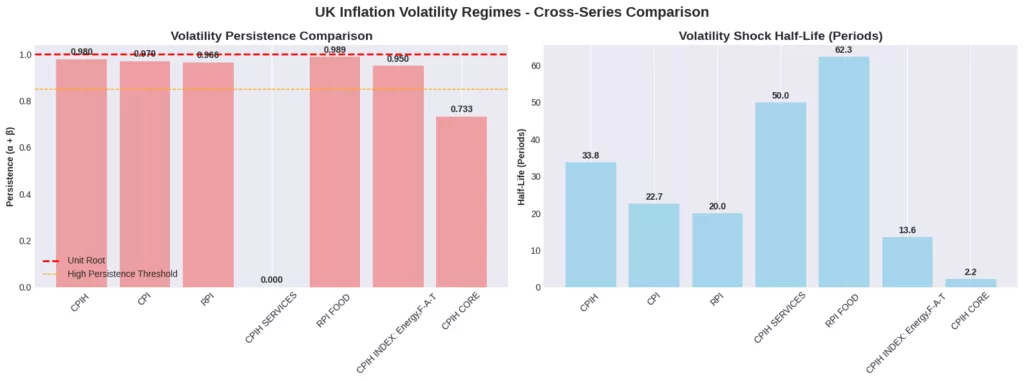
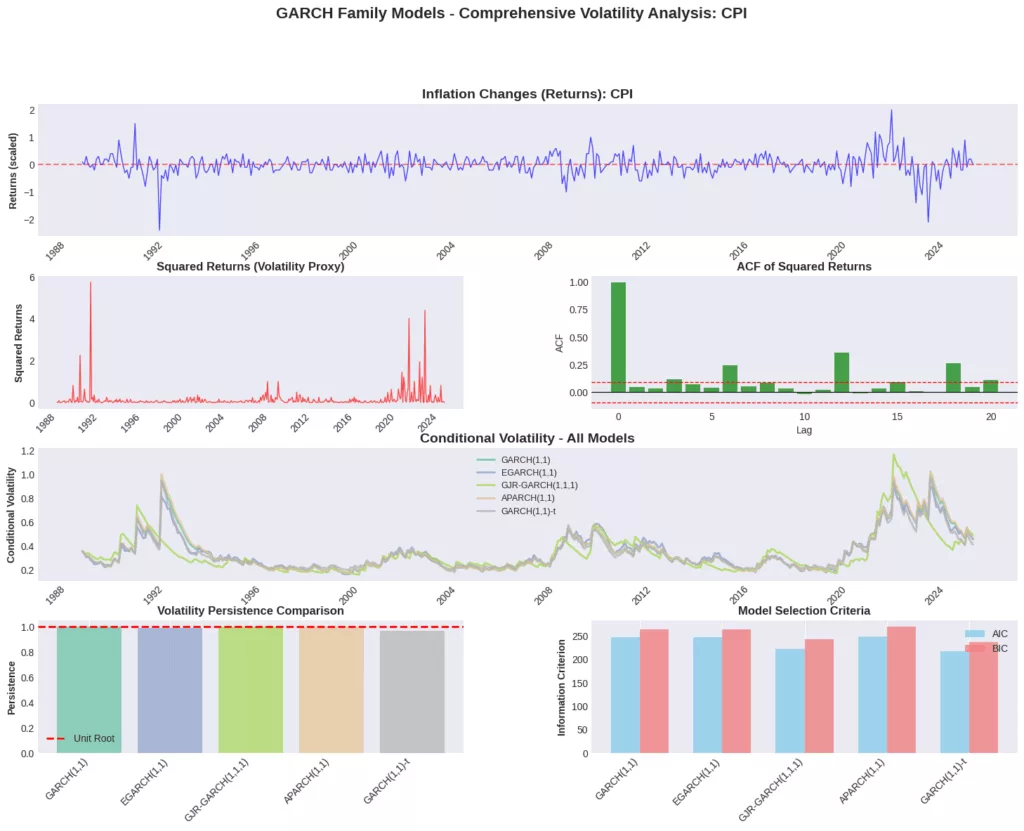
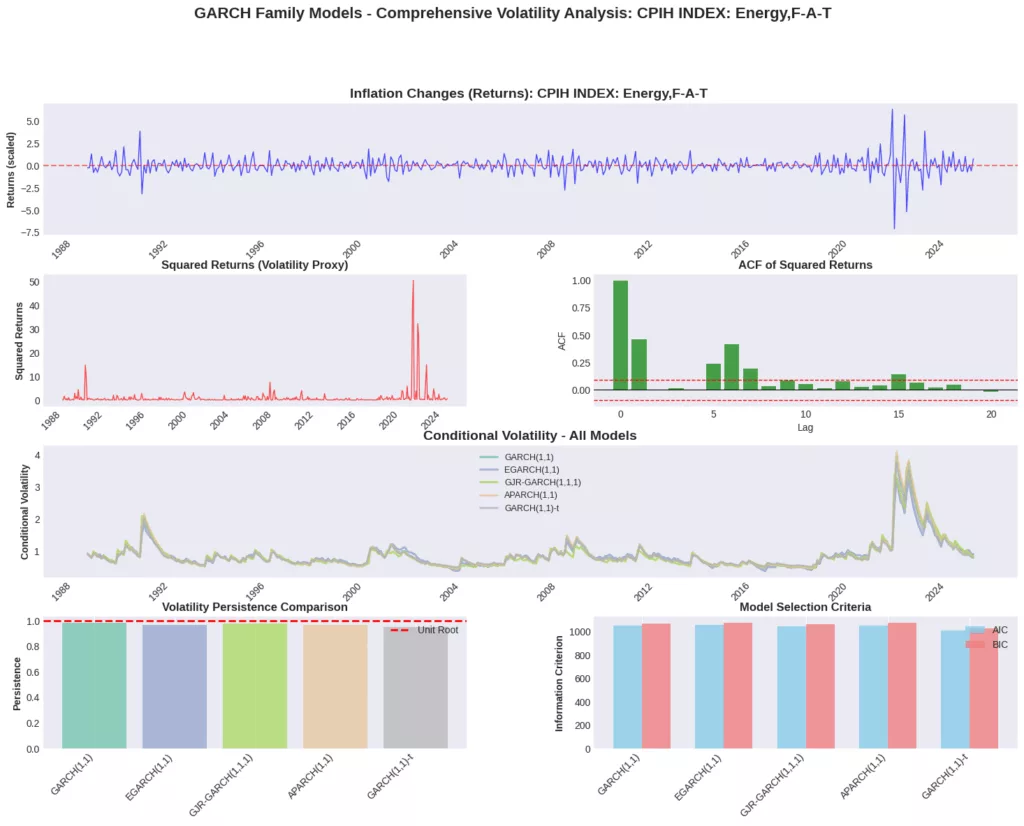
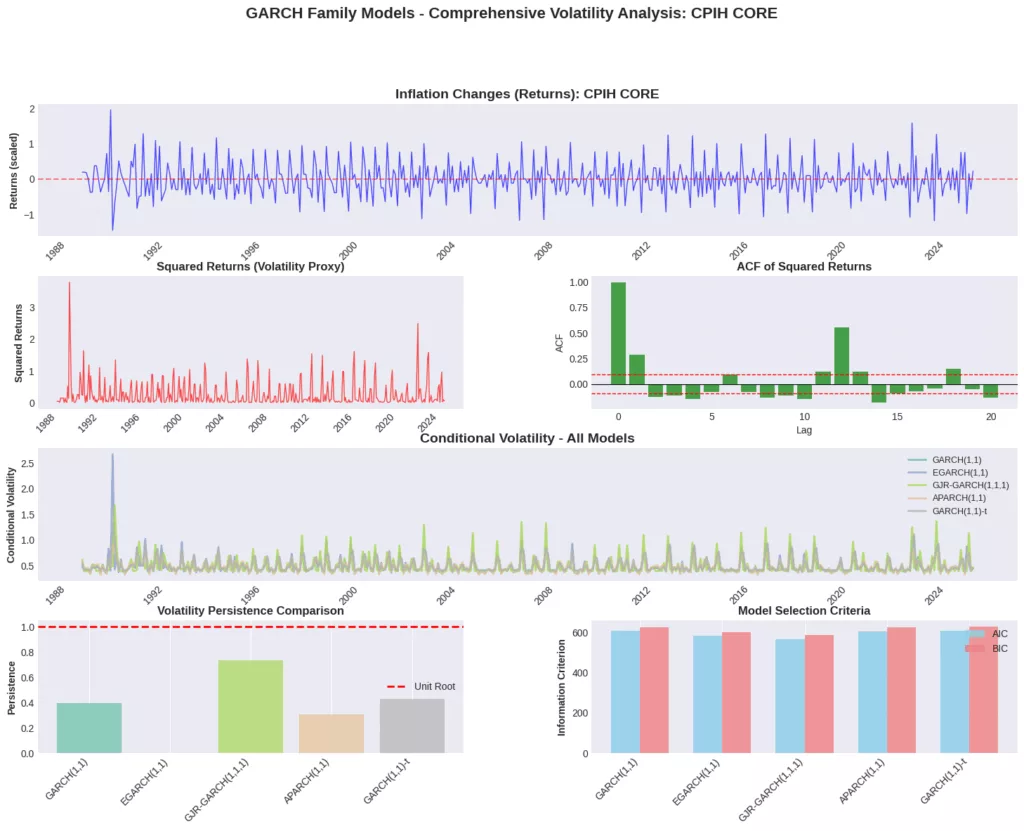
GARCH models reveal profound insights into the conditional volatility dynamics and shock persistence across UK inflation measures, with striking heterogeneity in how inflationary shocks propagate through different sectors. The analysis demonstrates that headline inflation measures (CPIH, CPI, RPI) exhibit extremely high volatility persistence near unit root processes, with persistence parameters ranging from 0.966 to 0.993 and remarkably long half-lives of 20-69 periods. This indicates that inflationary shocks to these core measures have enduring effects that can persist for multiple years, creating significant challenges for monetary policy effectiveness. The GARCH(1,1)-t models consistently emerged as optimal specifications, capturing both the fat-tailed nature of inflation distributions (evidenced by significant Student-t parameters) and the strong autoregressive conditional heteroskedasticity. Particularly concerning is the near-integrated GARCH behaviour observed in CPI (persistence: 0.999999) and RPI Food (0.989), suggesting these series exhibit shock accumulation where volatility shocks permanently alter the inflation variance process. In stark contrast, services inflation (CPIH SERVICES) and core inflation (CPIH CORE) display low to moderate persistence with half-lives under 3 periods, indicating more rapid mean reversion and suggesting these components may be more responsive to policy interventions. The exceptionally high ARCH effects (α parameters of 0.10-0.18) across most series reveal significant volatility clustering, where large inflation changes tend to be followed by further large changes, creating persistent periods of elevated inflation uncertainty. The energy component shows moderate persistence (0.950) but with substantial ARCH effects (0.163), reflecting the temporary but intense volatility spikes characteristic of energy markets. These conditional volatility parameters fundamentally explain why certain inflation components prove more stubborn for policymakers: the combination of high persistence and strong ARCH effects creates self-reinforcing volatility cycles that can persist long after initial shocks have dissipated, complicating the path to sustained price stability and highlighting the critical importance of forward-looking policy frameworks that account for these persistent volatility dynamics.
UK Inflation Volatility Regimes Persistence: Analysis & Policy Implications
| Series | Best Model | Persistence | Half-Life | Volatility Regime | Shocks persist ~3 years; near unit root behaviour creates long-lasting volatility cycles | Policy Priority |
|---|---|---|---|---|---|---|
| CPIH | GARCH(1,1)-t | 0.9797 | 33.8 periods | Very Persistent | High Cost of living impact | Highest – Primary inflation target |
| CPI | GARCH(1,1)-t | 0.9699 | 22.7 periods | Very Persistent | Shock effects last ~2 years; strong ARCH effects create volatility clustering | Highest – Headline measure |
| RPI | GARCH(1,1)-t | 0.9659 | 20.0 periods | Very Persistent | Housing-cost driven volatility persists ~1.7 years | Energy shocks persist ~1+ year despite their global nature |
| CPIH SERVICES | EGARCH(1,1) | 0.0000 | Infinite | Low Persistence | Services volatility decays immediately; no persistence in shocks | Medium – Quick policy response possible |
| RPI FOOD | GARCH(1,1) | 0.9889 | 62.3 periods | Very Persistent | Extreme persistence – shocks last ~5+ years; near-permanent volatility effects | Critical – Food security implications |
| ENERGY F-A-T | GARCH(1,1)-t | 0.9503 | 13.6 periods | Very Persistent | Energy shocks persist ~1+ years despite their global nature | High – External shock vulnerability |
| CPIH CORE | GJR-GARCH(1,1,1) | 0.7325 | 2.2 periods | Moderately Persistent | Core volatility decays in ~2 months; moderate mean reversion | Medium – Underlying stability |