- Artificial intelligence (AI) and automation are reducing the demand for human labour across various sectors, leading to a potential decrease in the overall workforce required in the future.
- This substitution of human labour by computing power raises significant questions about who will pay income taxes and generate government revenues in an increasingly automated economy.
- Philosophers like Günther Anders in the 1960s and 70s already observed humanity becoming “obsolescent” as technological change outpaced human advancement, making human labour less useful in production.
- The shrinking share of labour in the production function due to automation poses a major unknown for state tax collection.
- The potential for mass unemployment due to automation might necessitate discussions about implementing a Universal Basic Income (UBI).
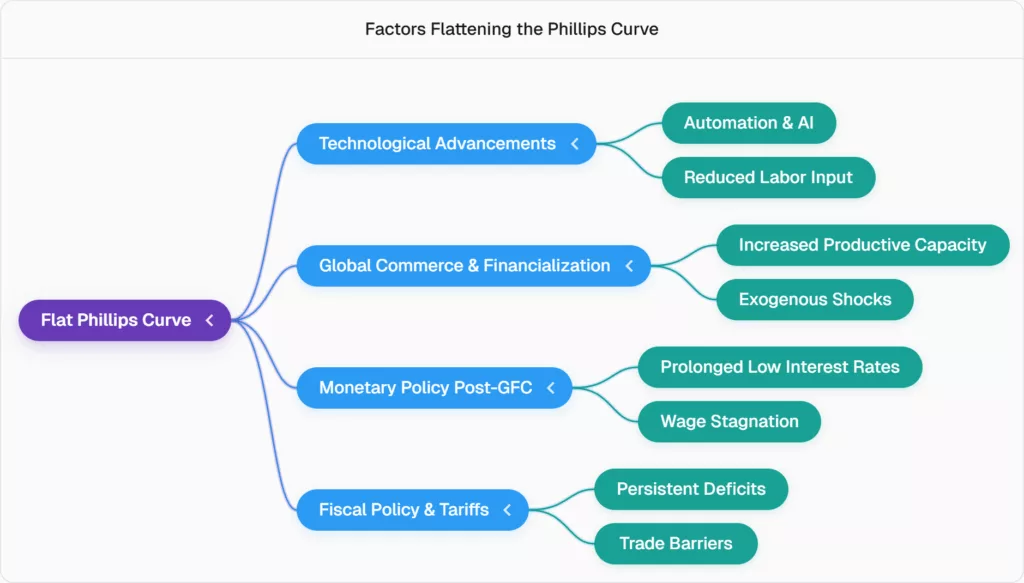
The Flattening of the Phillips Curve
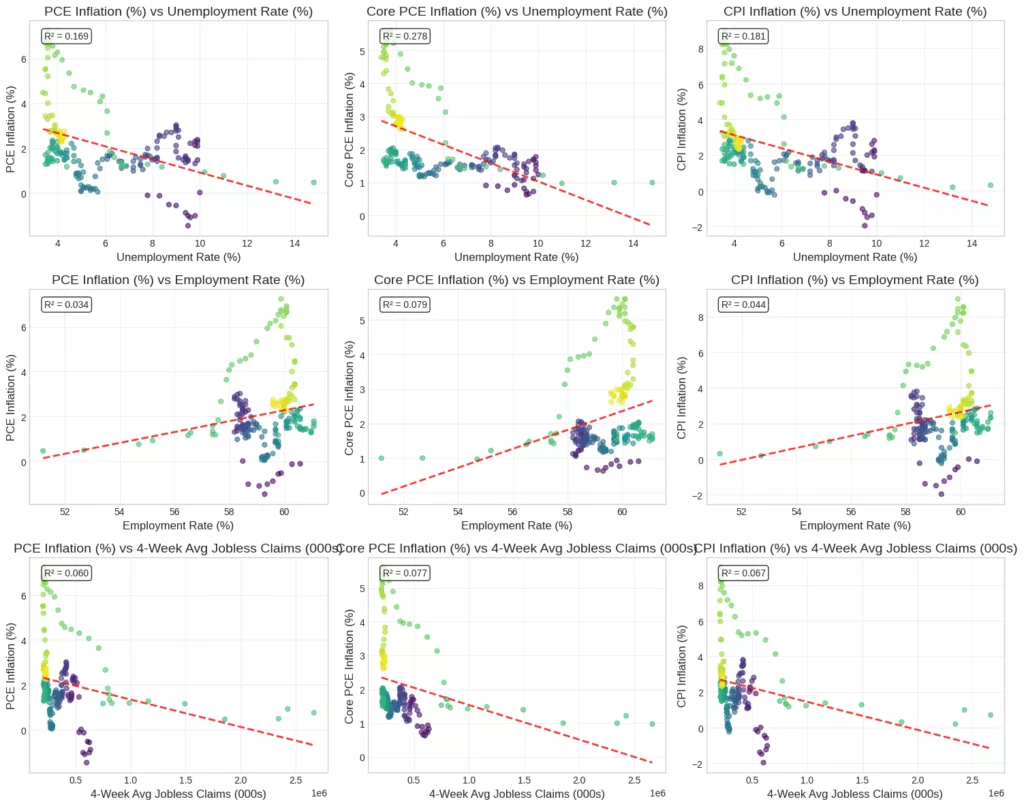
- The traditional relationship between wages and inflation, as well as unemployment and prices, has significantly weakened over the past decade.
- Empirical data from 2007 to 2025 indicate that the interaction between inflation, prices, and unemployment has become increasingly mild.
- The slope of the Phillips curve, represented by the kappa parameter, is very close to zero (e.g., 0.04), signifying a weak or almost non-existent linear relationship between unemployment/employment levels and inflation.
- Statistical measures like the R-squared show that the level of unemployment explains only a small percentage of inflation (e.g., 27-28% for core PCE, 18% for CPI, and 4% for the employment rate), suggesting many other factors are at play.
- Central banks’ reaction functions, particularly for the Federal Reserve, show a strong focus on price stability and full employment, but less on the output gap, allowing the economy to run hot.
Alternative Drivers of Inflation
- Tariffs and Currency Depreciation: These are exogenous factors that significantly impact inflation independently of the labour market.
- For example, a combination of dollar depreciation (18%) and tariffs (15%) could lead to an aggregate import cost increase of 33% for US importers.
- Such policies can cause a dramatic slowdown in global commerce, reducing imports and exports, which ultimately kills off production and GDP while driving up inflation.
- Fiscal Policy and Persistent Deficits: Governments persistently running fiscal deficits can lead to higher inflation, as the only way to reduce the deficit is through inflation.
- The government budget constraint implies that persistent deficits must be balanced by rising prices to keep the ratio between budget and prices in equilibrium.
- This can result in stagflation, a scenario of higher inflation and higher unemployment, especially if accompanied by low productivity growth and increased borrowing costs for corporates.
Macroeconomic Models and Parameters
- Dynamic Stochastic General Equilibrium (DSGE) Model: This model accounts for the time component, inflation expectations, and household consumption valuation.
- Beta (Discount Factor): Represents household patience or impatience regarding consumption over time. A beta of 0.99 suggests that a dollar tomorrow is valued at 99 cents today, allowing for delayed consumption or investment.
- The sigma parameter measures consumer risk aversion to economic shocks.
- The kappa parameter (Phillips Curve Slope): Represents household patience or impatience regarding consumption over time. A beta of 0.990.99 suggests that a dollar tomorrow is valued at 9999 cents today, allowing for delayed consumption or investment.
- reflects the slope of the Phillips curve, consistently found to be very low (e.g., 0.0447), indicating a flat curve.
- The rho parameter measures persistence of interest rate or unemployment rate shocks in the economy (e.g., 0.85 for unemployment persistence, meaning slow recovery).
- New Keynesian Phillips Curve (NKPC) Model:
- The basic NKPC model relates inflation to expected future inflation, the kappa parameter (slope), and the output gap.
- The Hybrid NKPC model is considered the most precise framework, incorporating both forward-looking (gamma_f) and backwards-looking (gamma_b) inflation expectations, which are often balanced (e.g., $$50/50$$). This model also shows the kappa parameter to be very close to zero, confirming the flat Phillips curve.
- Vector Autoregressive (VAR) and Vector Error Correction Models (VECM):
- VAR models transform data into column vectors and matrices, applying autoregressive lags.
- VECM helps understand how variables correct their responses to lagged shocks, particularly useful for analysing labour market dynamics.
- The alpha coefficient in VECM measures the speed of change in co-integrating factors, while the beta coefficient defines the co-integrating factors themselves (e.g., GDP and consumption).
- VECM analysis shows that in response to labour market shock, average weekly hours tend to decrease, and average hourly earnings adjust downwards.
Central Bank Monetary Policy and Its Effectiveness
- The Federal Reserve’s reaction function shows a strong focus on price stability (inflation gap, e.g., a 1.16% response for every 1%increase in inflation) but a near-zero response to the output gap (GDP component).
- This indicates that the Fed tolerates a large positive output gap, even when inflation is high, and does not actively manage aggregate demand through monetary policy.
- The 2% inflation target, often imposed by fiscal authorities, is criticised as an artificial and unachievable target that should be discarded.
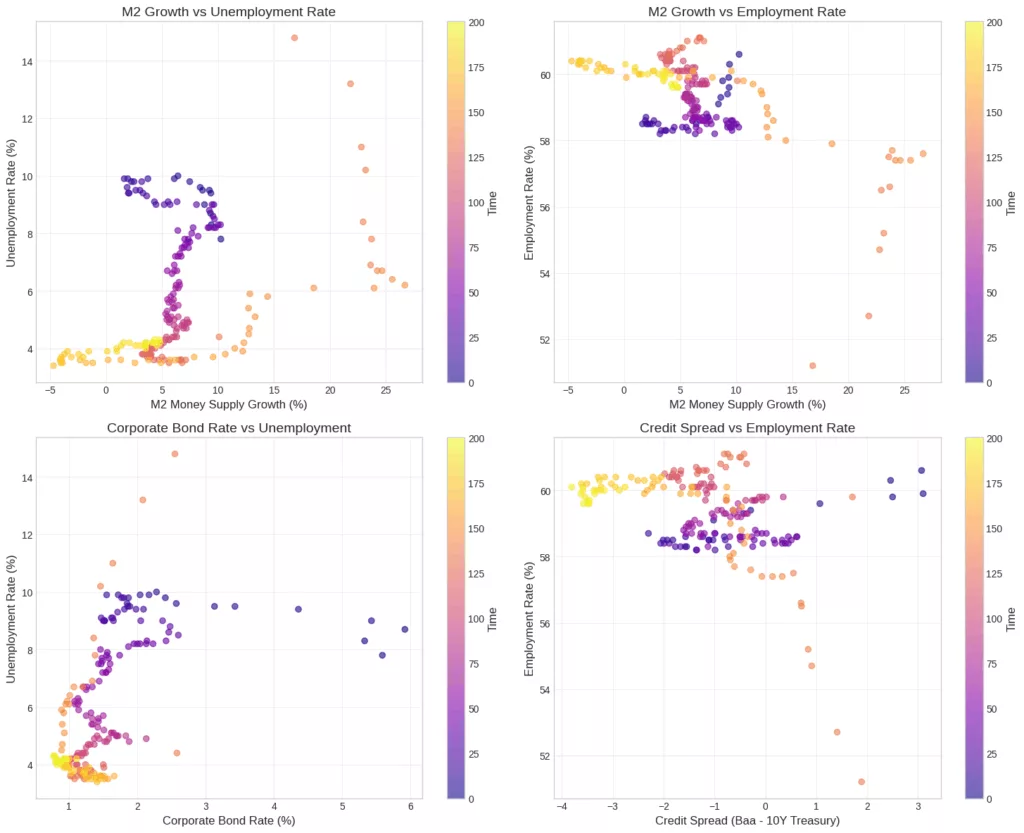
- Money supply growth does not consistently lead to low unemployment; historical data indicate that high money supply can coincide with high unemployment, especially during recessions.
- Credit spread (cost of borrowing for corporates) has a strong correlation with employment levels: compressed spreads correlate with higher employment, while widening spreads correlate with lower employment.
- The monetary policy framework, characterised by negative real interest rates and a focus on inflation expectations, has contributed to wage stagnation over the past decade, particularly in Europe.
Critique of GDP Measurement and Economic Structure
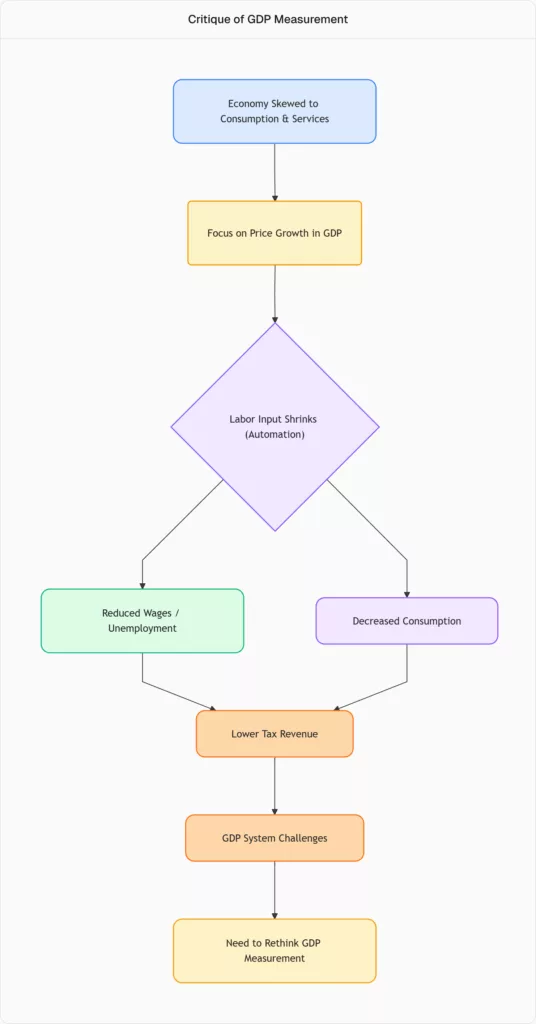
- The current method of measuring Gross Domestic Product (GDP) is criticised for being overly skewed towards consumption and often reflecting price increases rather than actual productivity or the quality of work.
- The classical GDP formula is Y=C + I + G + (IM – EX), where the consumption component (C) has a large multiplier effect, making the economy overly reliant on consumption rather than investment.
- An economy increasingly reliant on services and immaterial goods, coupled with diminishing labour input due to automation, will shrink consumption and government revenue, potentially leading to a collapse of the current GDP system.
- There are ethical concerns regarding what activities contribute to GDP (e.g., tobacco, weapons) and whether growth benefits all segments of society, particularly when some forms of employment are increasingly undervalued.
Here is a flowchart illustrating the critique of the current GDP measurement and its consequences:
Neutral Interest Rate Estimation
- Macroeconomic models, including DSGE and NKPC, provide various estimates for the neutral level of interest rate, ranging from 2.2% to 3.1% and 4%.
- The speaker argues that the investment-grade corporate bond rate is a more effective measure of the neutral interest rate than the Federal Funds Rate, as it reflects the true cost of borrowing for businesses and their risk of insolvency, directly impacting employment.
- Historically, the Fed Funds Rate has been kept artificially low, leading to negative real interest rates and an accommodative monetary policy that favours consumption over investment.
- This approach, while aiming for GDP growth fueled by prices, disregards wage stagnation and the flat Phillips curve, allowing inflation to run high without a wage-price spiral.
- The estimated neutral interest rate derived from the beta parameter of the DSGE model (e.g., 3.1%) is notably similar to the estimated neutral corporate bond rate.
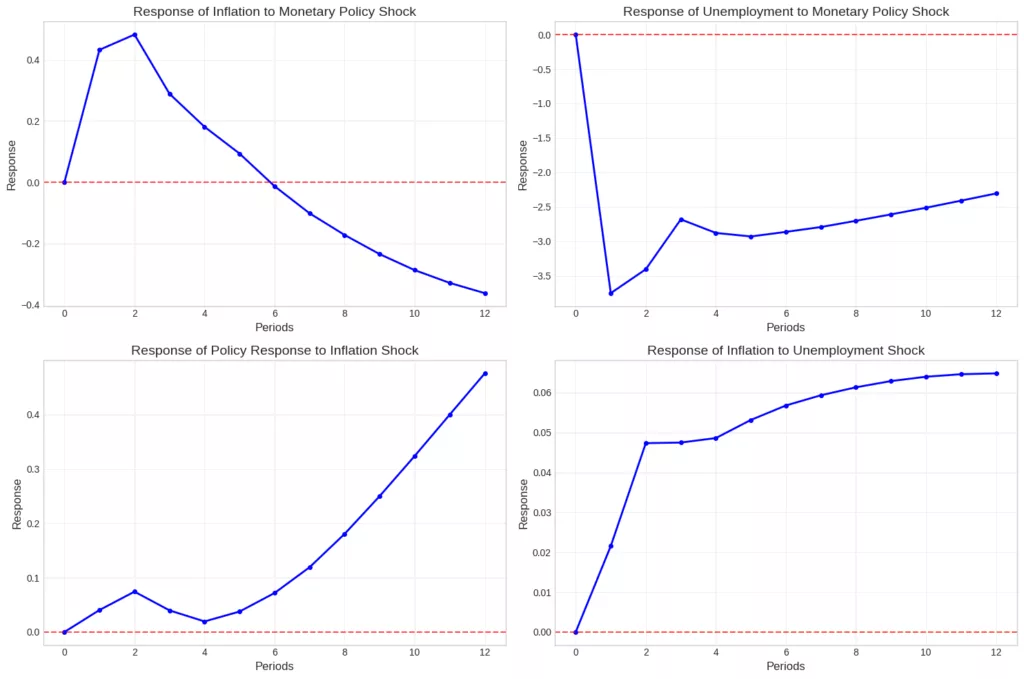
ECONOMIC POLICY ANALYSIS MONETARY POLICY TRANSMISSION ANALYSIS
Key Transmission Channels: Fed Funds -> Unemployment: -0.592 (Strong) Fed Funds -> Inflation: 0.334 (Moderate) Corporate Rate -> Employment: -0.138 (Weak) M2 Growth -> Inflation: -0.168 (Weak) PHILLIPS CURVE STABILITY ANALYSIS
Phillips Curve Correlation: First Half Sample: 0.201 Second Half Sample: -0.347 Stability: Unstable Rolling Correlation Mean: -0.153 Rolling Correlation Std: 0.534 Relationship Stability: Low POLICY
RECOMMENDATIONS • Consider stronger monetary policy response to inflation (φ_π < 1.5) • Consider more countercyclical monetary policy (low output response) • Phillips Curve appears flat – demand management may be less effective
MODEL COMPARISON AND COMPREHENSIVE SUMMARY
1. DSGE Model Results: ✓ Estimation successful – Discount factor (β): 0.9924 – Risk aversion (σ): 0.5000 – Phillips curve slope (κ): 0.0447 – Inflation response (φ_π): 1.1644 – Output response (φ_y): 0.0000 – Interest rate smoothing (ρ_r): 0.9793 – Unemployment persistence (ρ_u): 0.8499 2. New Keynesian Phillips Curve Results: Basic NKPC: ✓ Successful Hybrid NKPC: ✓ Successful Extended NKPC: ✓ Successful 3. Key Economic Insights: – Phillips Curve relationship shows temporal instability – Monetary policy transmission operates through multiple channels – Money supply growth correlates with employment and inflation dynamics – Corporate borrowing rates significantly impact labour market outcomes – Credit spreads provide early warning signals for employment changes 4. Methodological Contributions: – DSGE framework captures structural economic relationships – NKPC models highlight forward-looking inflation dynamics – Dynamic correlation analysis reveals time-varying relationships – Impulse response functions quantify policy transmission mechanisms
READ MORE:
- CONSTITUTIONAL ASYMMETRY, ECONOMIC DEPENDENCY,AND THE CASE FOR NATIONAL SELF-DETERMINATION
 Wales, Scotland, and Northern Ireland in Historical,Sociological and Economic Perspective This paper examines the structural, historical, and economic contradictions inherent in the United Kingdom’s constitutional settlement as it pertains to Wales, Scotland, and Northern Ireland. Drawing on political theory, economic data, historical sociology, and comparative constitutional studies, it argues that the current devolution framework, while… Read more: CONSTITUTIONAL ASYMMETRY, ECONOMIC DEPENDENCY,AND THE CASE FOR NATIONAL SELF-DETERMINATION
 - The Necessity of a United Nations HQ Relocation to the Hague with a Permanent Nuremberg Tribunal.The Impunity Crisis of Rogue Governments
 The world witnesses today an unprecedented crisis of accountability in international law. As the genocide in Gaza unfolds before global eyes, as war crimes multiply across Ukraine, Myanmar, and countless other conflicts, the United Nations stands paralysed, not by lack of legal framework, but by institutional capture that protects the very criminals it should prosecute.… Read more: The Necessity of a United Nations HQ Relocation to the Hague with a Permanent Nuremberg Tribunal.The Impunity Crisis of Rogue Governments
 - The Digital Job Posting Bubble: Quantifying Phantom Demand in Online Labor Markets
 Are businesses and corporates truly hiring ? Has the digital economy become a massive convenience mystification of actual economic activities? How large, systemic and unstable is the assets bubble built by Wall Street financial engineering and gambling addiction? What are the empirical evidence of structural distortions in digital labor markets that represent a significant and… Read more: The Digital Job Posting Bubble: Quantifying Phantom Demand in Online Labor Markets
 - United States Criminality and Impunity: Historical-Sociological Perspective of United States Unaccountability and Impunity at the behest of International Law
 The United States emerged from World War II as a principal architect of the modern international legal order, including the Nuremberg principles, the Geneva Conventions, and the Universal Declaration of Human Rights. Supreme Court Justice Robert Jackson, who served as chief prosecutor at Nuremberg, articulated a principle that would become foundational to international criminal law… Read more: United States Criminality and Impunity: Historical-Sociological Perspective of United States Unaccountability and Impunity at the behest of International Law
 - What Everyone Gets Wrong About Inflation: 5 Surprising Economic DataThe public is rightly concerned about the rising cost of living, and the dominant economic narrative offers what seem like simple truths: falling prices are a bad omen, and we must accept higher unemployment as the bitter medicine needed to cure inflation. But this conventional wisdom isn’t just wrong—it’s dangerously flawed, leading to policies that… Read more: What Everyone Gets Wrong About Inflation: 5 Surprising Economic Data