The housing market has probably increased to risky levels for credit markets. Since 2009, from the lowest average price to Q4 2022, Housing prices in the UK capital have increased by an average of 195.22%.
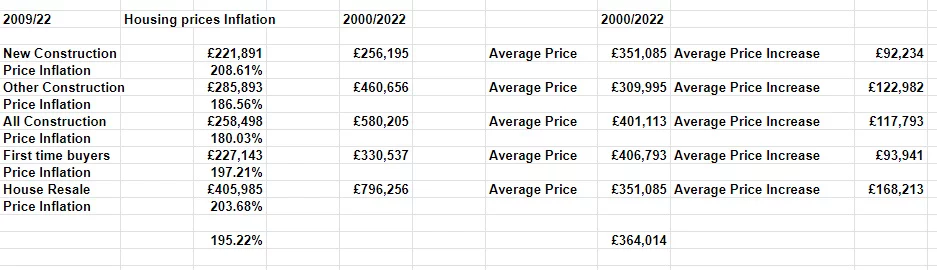
The average First-time buyer house price in 2009 was £234,000 compared to Q4 2022 £461,000, which equates to £227,150 price Inflation (197.2%), however, that’s not the peak price, which instead was Q3 2022 £490,000. Discrepancies in the housing market inflation are larger taking the years 2000/2022 as time series. Taking an average of all housing market prices the data gives £ 364,000 as the average price.
To understand the Inflationary scale, the Owner-Occupier average price=£351,085 (2000/22 time-series). The same item in Q4 2022 equates to £798,000. Housing Prices Sale transactions have increased by £446,481= 227% from 2000 to 2022. Measuring the percentage change Quarter on Quarter, time series years 2000/22, Housing Prices increases have been +120.44%(new houses), 153.05%(other houses), +145.14%(all constructions), +143.41(first-time buyer), +158.35% (owner-occupier).
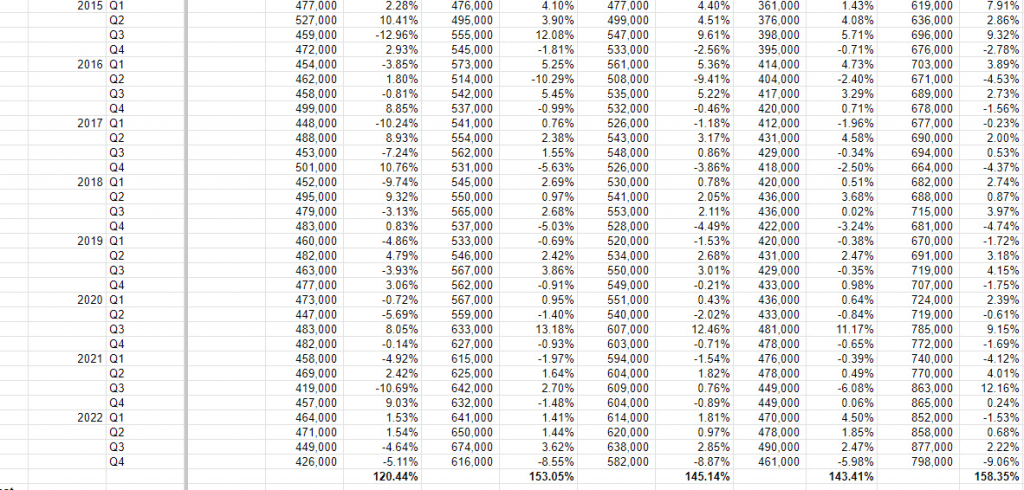
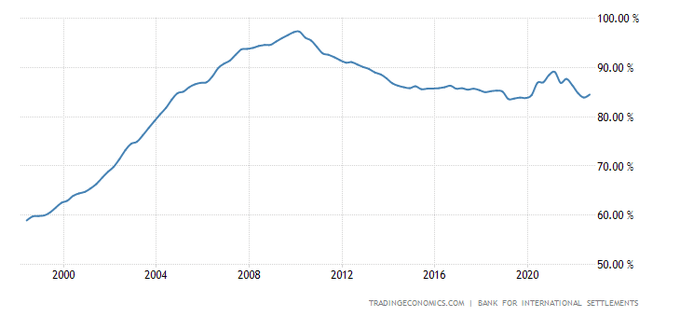
Percentage changes quarter on quarter account for fluctuations in the housing market, therefore price increases and decreases. Overall net figures average 144% price increases median across all categories of houses. Although these could seem healthy equity returns on House prices, most of these are on paper and many of these are outstanding housing credit finance, which in the UK for Q4 2022 amounted to £1.6 Trillion pounds, while also household debt/GDP = 84.5%.
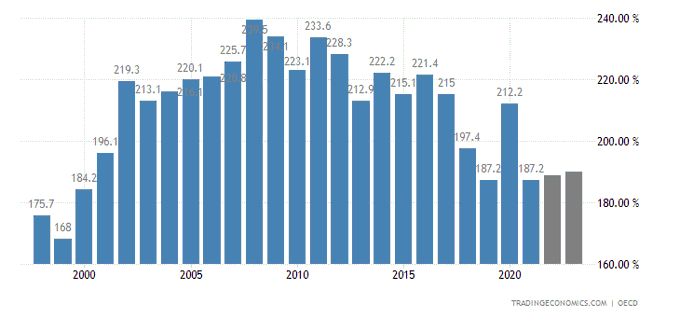
Private Debt to GDP = 187.2%
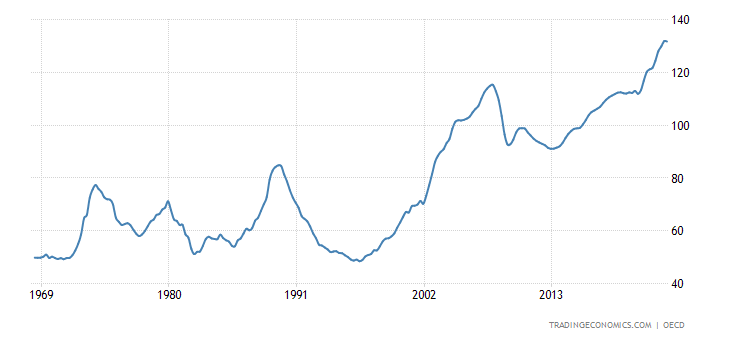
The Housing Market Price to Rent Ratio has surged to 131.73. The graph below explains the constant inflationary trend in the housing market, determined in large part by commercial and speculative housing market activities.
Commercial Property Price Index decreased by 0.2% in March. The index has fallen by -15% since property prices peaked a year ago. The chart tracks CRE in America. “Transaction volumes remain low, but our estimates put the bid price about 15% lower than it was a year ago,”
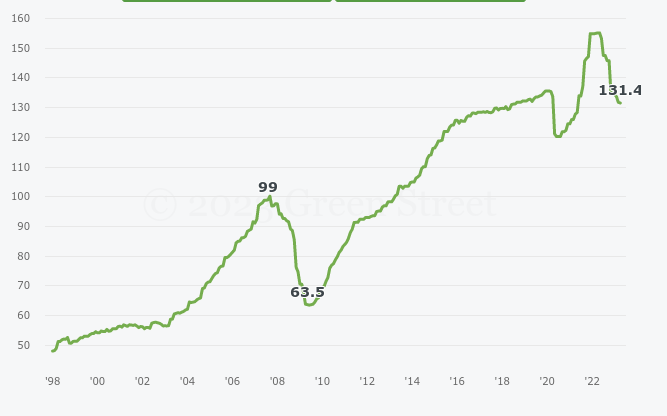
“The change in pricing varies by property type. Offices space has seen the largest price declines, where even high-quality properties are down 25% over the past year.”
The Commercial Property Price Index in Europe decreased by 6.7% during the first quarter of 2023. The index, which measures a broad swathe of Pan-European commercial properties, now sits 21% below its May ’22 peak.
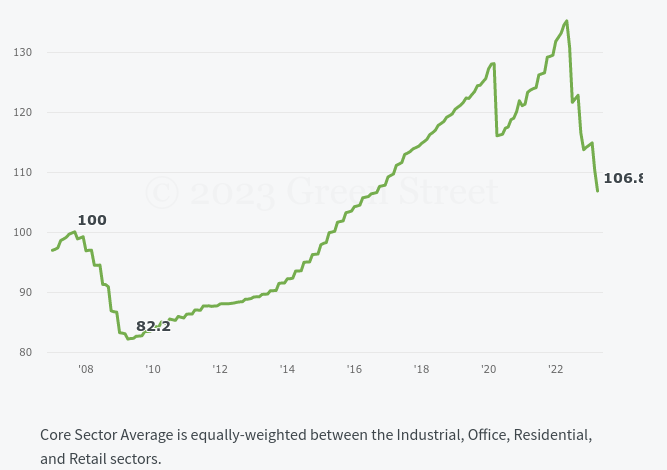
The residential sector bore the brunt of the pain this quarter with a 10.4% price decline, although metros with above-average starting yields and limited rental regulation went relatively unscathed. Office investors returned to their post-Covid form as bids fell -9.5%, amidst an uncertain economic and financing backdrop. Industrial and retail asset prices fared a bit better, falling only 4.8% and 2.0%, respectively. Resilient fundamentals buoyed the former whilst high cap rates dressed up the latter.