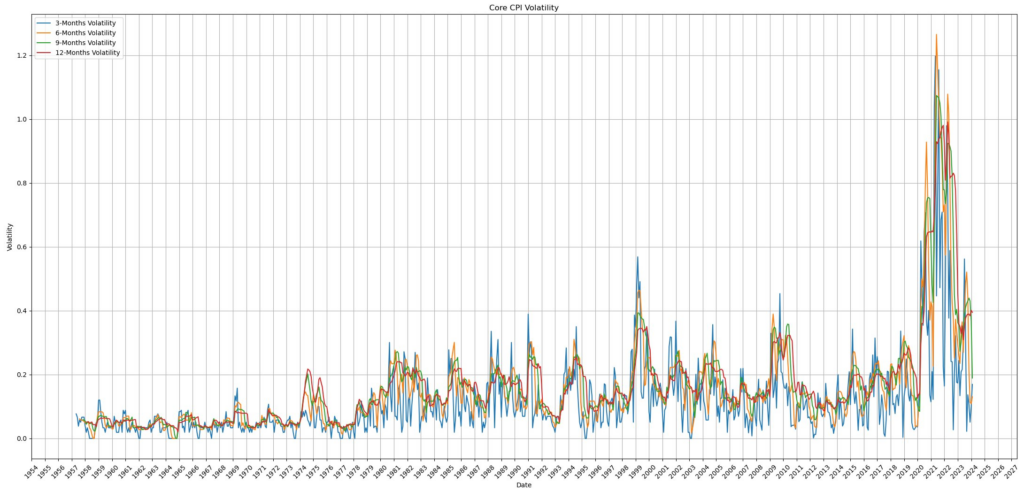
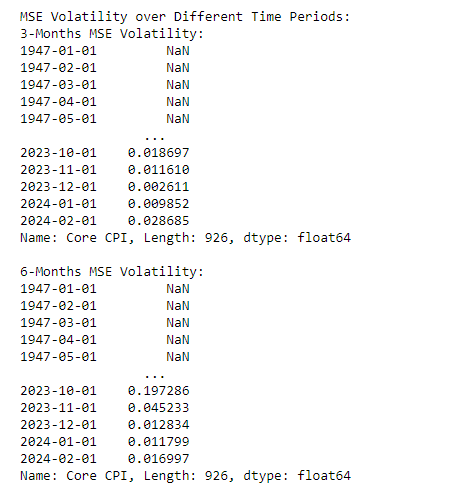
Study of Inflation metrics volatility has been started with estimating the 3/6/9/12 months volatility extracted form Mean Squared Error in Core CPI in a range 0.2% 0.4%. Measure of volatility in Core CPI, that should be useful to determined the rolling standard deviation from the actual Core CPI and the expected CORE CPI.
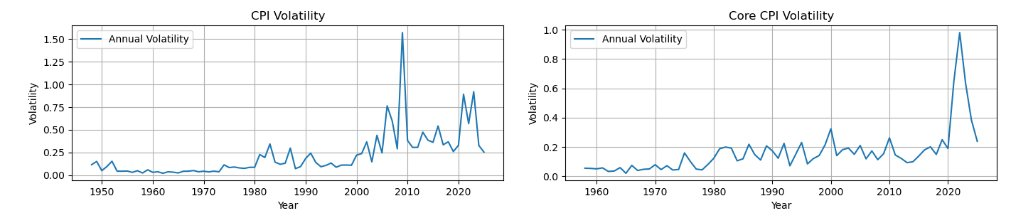
CPI and CORE CPI Volatility of Mean Squared Errors indicate 0.25% | 0.2% volatility in the 12 months horizon. That means percentage change measures of inflation are somewhat meaningless because they don’t measure the volatility and the residual errors in Inflation measures.
Volatility of inflation metrics will need to be a cornerstone parameter of monetary policy to implement and achieve stable 2.0% inflation.
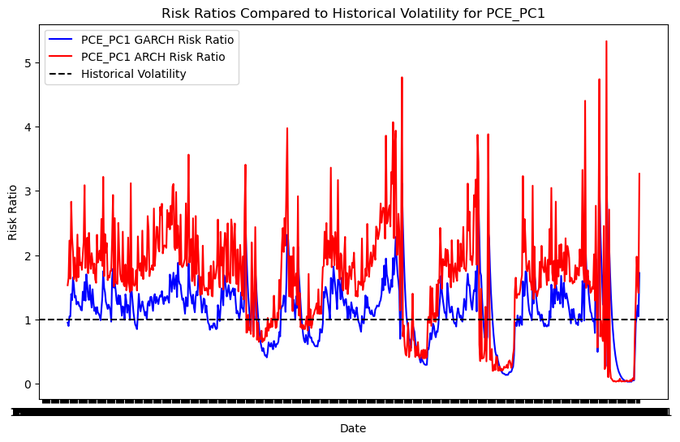
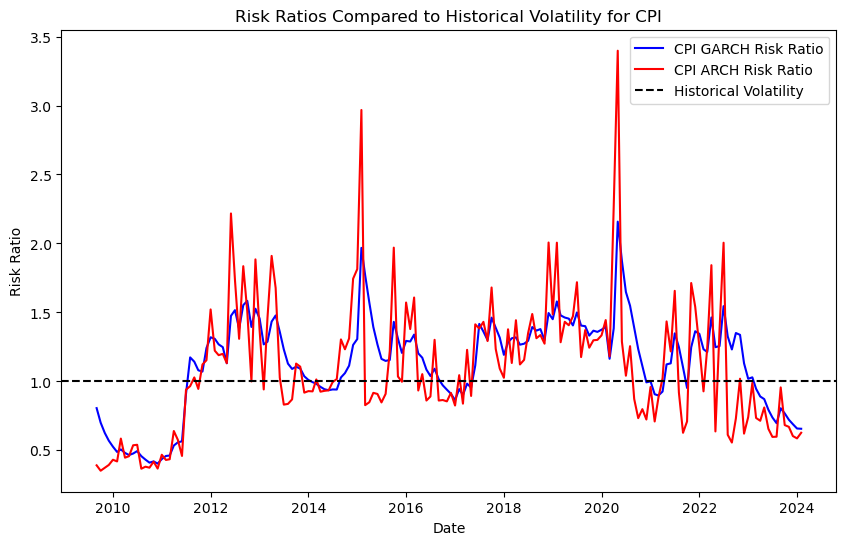
very interesting findings have been found with comparing Inflation metrics CPI, Core Inflation, PCE, ARCH, GARCH model compared to Historical Volatility of Inflation to evaluate Risk Ratio metrics of ARCH GARCH volatility trends to observe asymmetry with respect to Historical Volatility in order to build forecast model based on Risk Ratios, to understand when Inflation metrics would converge to Historical Volatility average.
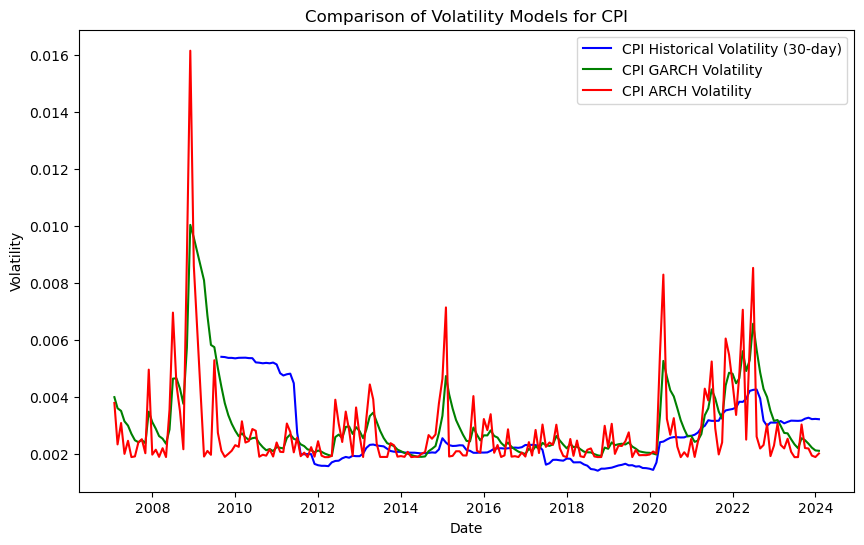
these two graphs have 30 days rolling volatility, where the Historical Volatility has been compared to CORE CPI measure of 30-days rolling volatility average.
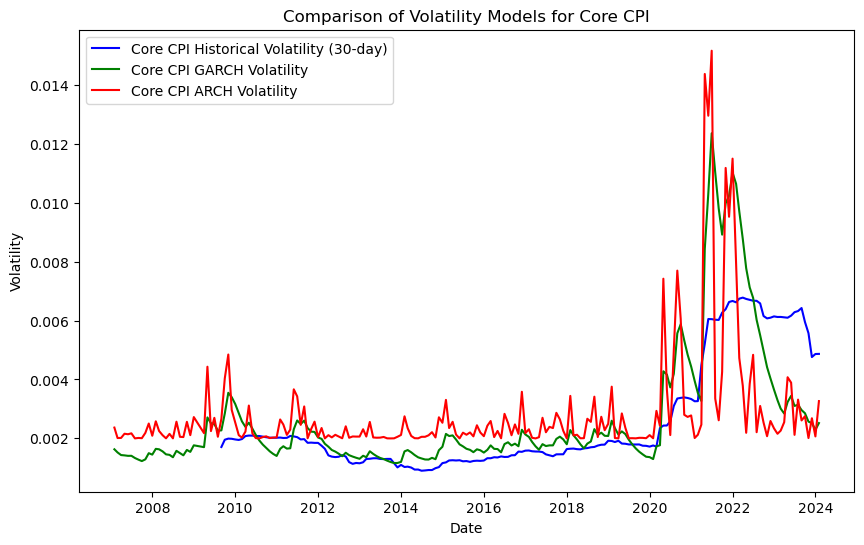
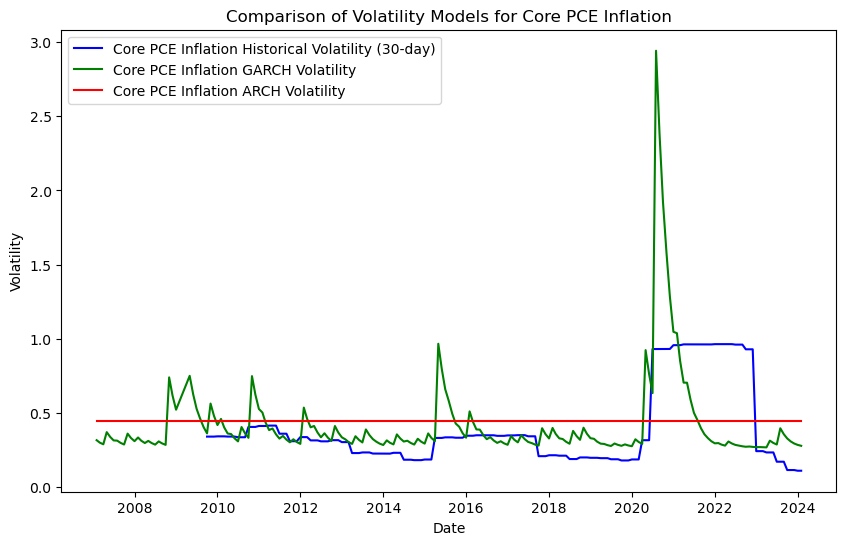
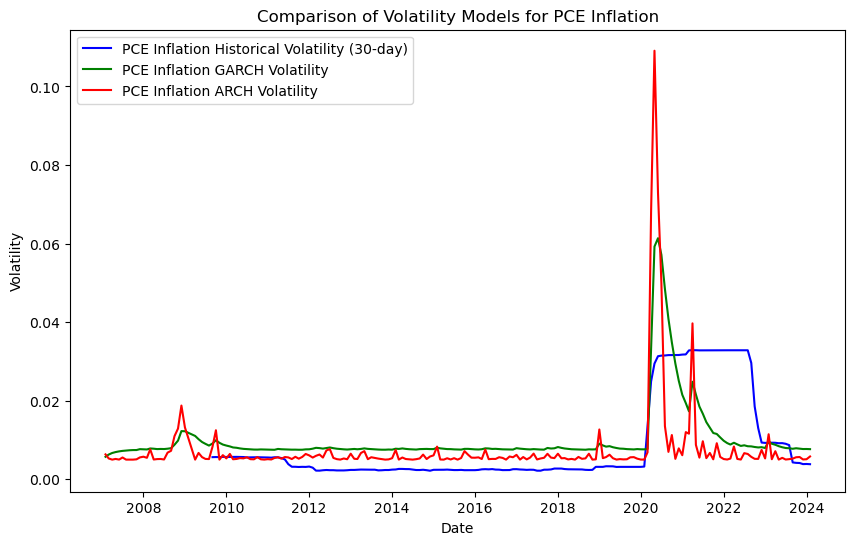

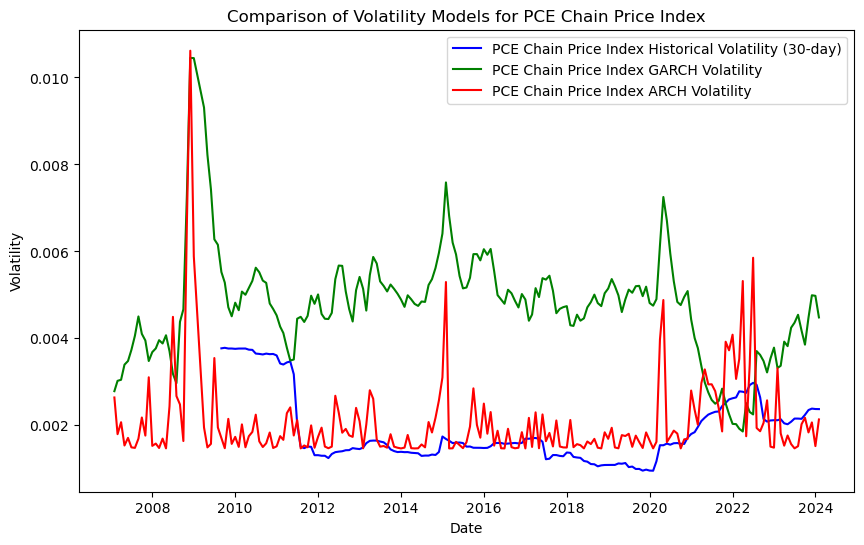
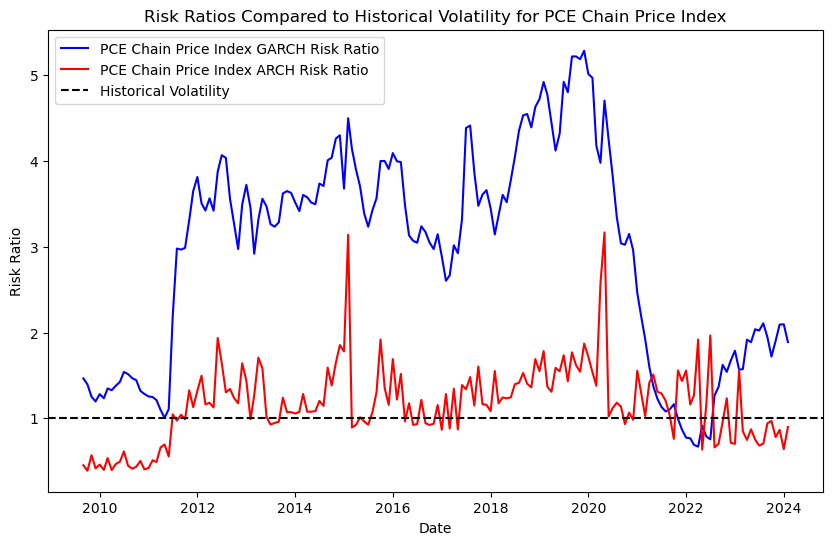
Historical Volatility said to ARCH and GARCH, see, Miss Inflation should see her Personal Consumption Expenditure converge lower to Historical Volatility average, while CORE INFLATION could be converging upward to higher Historical Volatility.Hence, going forward, Inflation on all sorts of basket with or without energy and food, could see prices increase a bit more again, and Miss Inflation this time will have to spend less, now, she has decided to marry isn’t she.
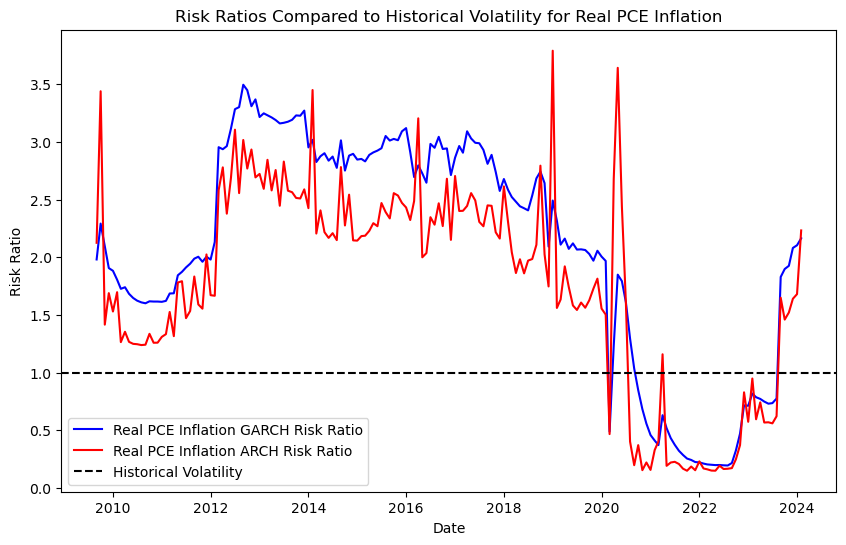
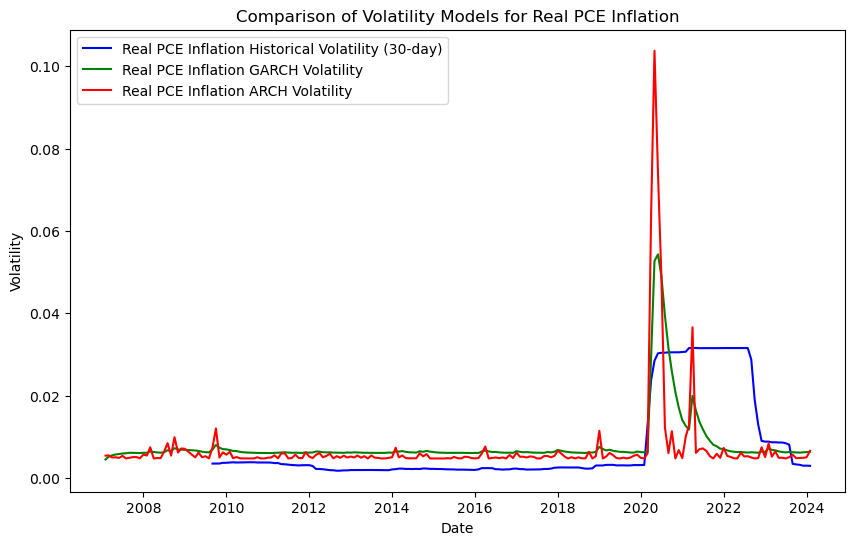
another chart hints that Americans, Personal Consumption Expenditure volatility has been running above historical volatility. Consistent with Q4: Real Consumer Spending 3.3%, GDP Final Sales 3.9%, and real GDP growth 3.4%. Higher than historical average PCE enhanced GDP growth