- Accurately capturing the pass-through effect of tariffs is challenging because econometric models cannot fully account for human behaviour, such as how exporters absorb tariffs or how trade volumes change.
- Human behaviour acts as an “unknown unknown variable” in economic modelling equations.
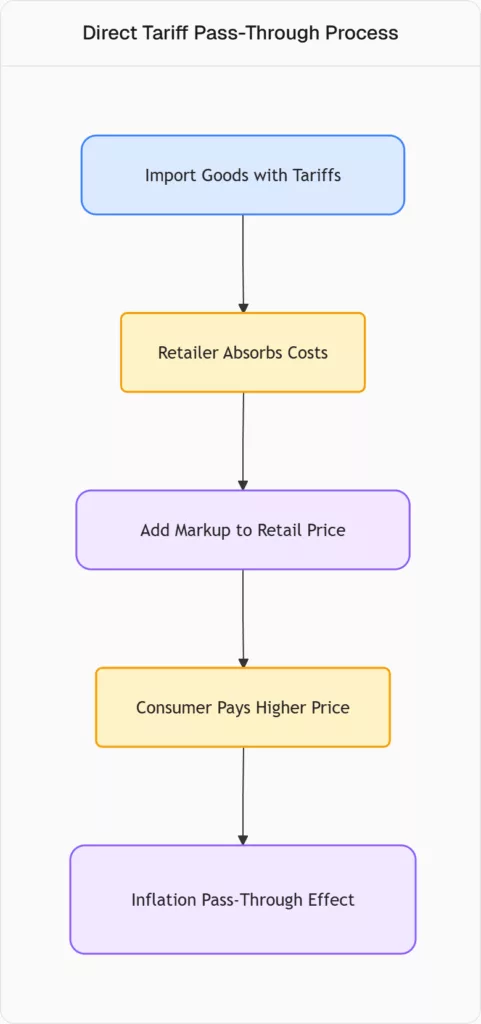
- The immediate and most direct inflationary pass-through effect in retail prices comes from businesses in the United States that import finished goods and resell them without transformation, such as retailers of products like cheese, wine, or coffee.
Here is a flowchart illustrating the direct tariff pass-through effect:
Modelling Approaches and Forecasts
- The video uses ARIMA (AutoRegressive Moving Average) and SARIMA (Seasonal ARMA) models, which are auto-aggressive integrated moving average models, with SARMA including a seasonality parameter.
- It also employs a multivariate OLS (Ordinary Least Squares) regression model to analyse the linear interaction between weighted average tariffs and inflation measures.
- The SARMA model forecasts a potential 1% upward jump in CPI (Consumer Price Index), reaching around 3.4% starting from January 2026, which would complicate monetary policy’s efforts to reduce interest rates.
- PCE (Personal Consumption Expenditures) forecast shows the SARMA model jumping to 2.8-3%, indicating higher inflation if these pass-through effects materialise.
- OLS regression results suggest that for every one unit increase in the weighted average tariff, CPI could increase by $$0.54$$ units with a one-period lag, with the one-lag effect being the most prominent.
- Regional OLS coefficients indicate varying impacts: Asia has a larger pass-through effect on core inflation (e.g., $$2.4$$ with three lags), while effects from Europe and Mexico are more contained.
- Lag effects are significant, meaning it takes a few months for tariff impacts to fully pass through to prices, creating a challenge for central banks.
Sector-Specific Tariff Impacts
- Semiconductors and other tech-related durable goods are identified as sectors likely to absorb the most significant tariff impacts, showing large pass-through effects on their Producer Price Index (PPI).
- Retail trade (e.g., restaurant meals, non-alcoholic beverages, used cars, apparel, medical care, prescription drugs) also shows positive pass-through effects, reflecting the direct import and resale nature of these goods/services.
- Manufacturing and semi-finished/intermediate goods generally show less direct impact or even deflationary effects in some models, possibly due to reduced demand for imports or increased domestic production.
- Energy components (like gasoline and electricity) are generally expected to have a negative or negligible pass-through effect on inflation because the United States is mostly self-sufficient in energy production, although some models show counterintuitive positive effects for electricity.
- Food products (e.g., meat, fruit, vegetables) produced domestically are generally not expected to be inflationary due to tariffs, although non-alcoholic beverages and “food away from home” show positive effects.
Monetary Policy Implications and Historical Context
- Higher customs duties lead to higher retail prices and an inflationary pass-through effect, making it difficult for the Federal Reserve to reduce interest rates, as it conflicts with achieving a 2% inflation target.
- The only way higher customs duties could lead to lower inflation is by sharply crashing aggregate demand and consumer spending, potentially inducing an economic recession.
- Historically, imposing high customs duties carries a significant risk of forcing an economy to reduce output and even leading to recession, as seen in the 1929-1930s.
- The concept of a 2% inflation target is questioned, as historical data from 2005 onwards shows that average inflation across various baskets consistently deviates from and is often above 2% (e.g., hospital services at 5%, education at 3.5%, full-service meals at 3.3%).
Average Inflation Rates for Select Baskets (from 2005)
| Inflation Basket | Average Annual Inflation Rate |
|---|---|
| Hospital Services | $$5.0\%$$ |
| Education | $$3.5\%$$ |
| Gasoline | $$3.8\%$$ |
| Full Service Meals | $$3.3\%$$ |
| Limited Service Meals | $$3.7\%$$ |