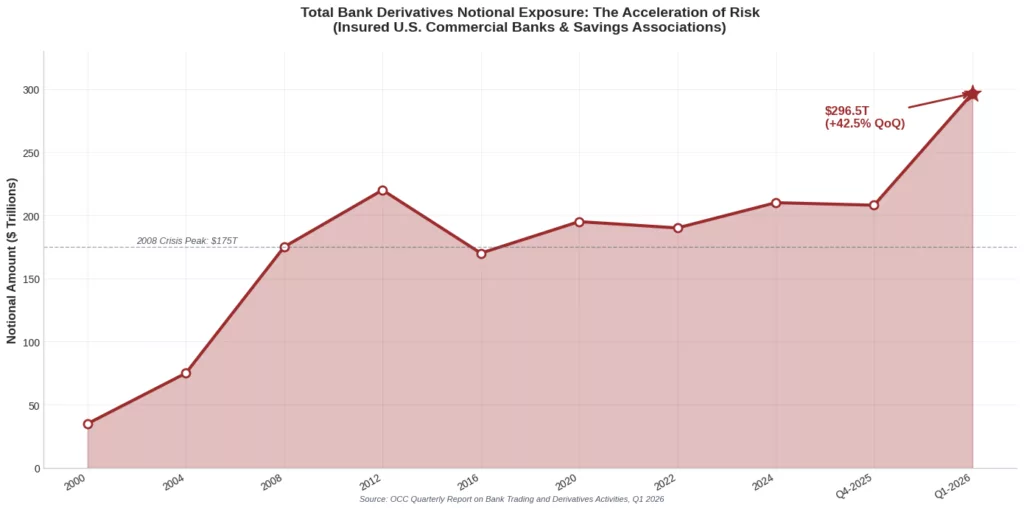
The Office of the Comptroller of the Currency’s quarterly reports on bank trading and derivatives activities for the fourth quarter of 2025 and the first quarter of 2026 reveal a financial system that has transcended traditional banking to become something far more dangerous and far less understood. The numbers alone demand attention: total derivative notional exposure across all insured United States commercial banks and savings associations reached two hundred ninety-six point five trillion dollars in the first quarter of 2026, representing a staggering forty-two point five percent increase from the two hundred eight point one trillion reported just one quarter earlier, and a forty-one percent jump from the two hundred ten point three trillion recorded in the first quarter of 2025. These are not incremental changes. They represent a fundamental acceleration in the scale of leveraged financial positioning that bears no relationship to the real economy it supposedly serves.
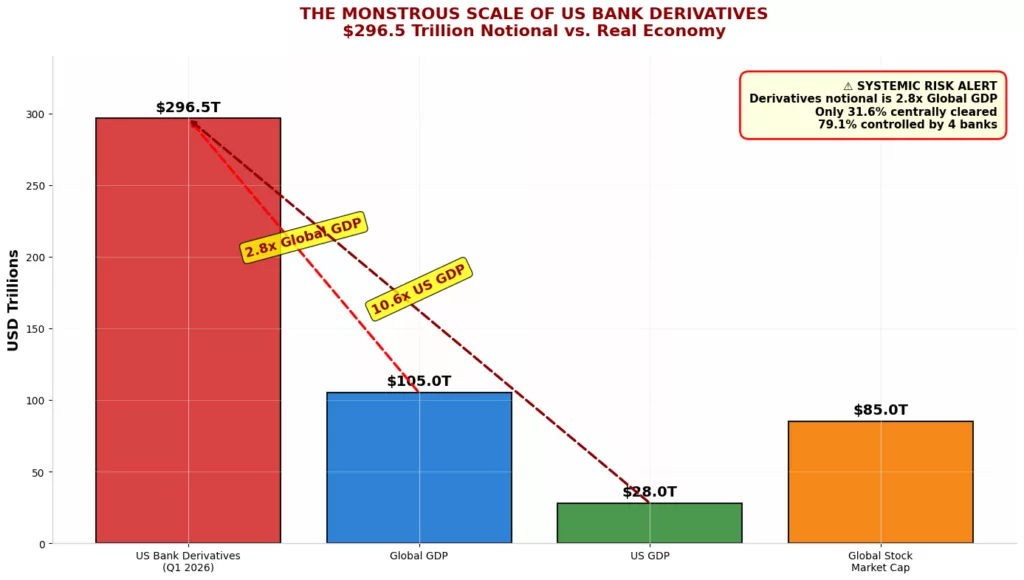
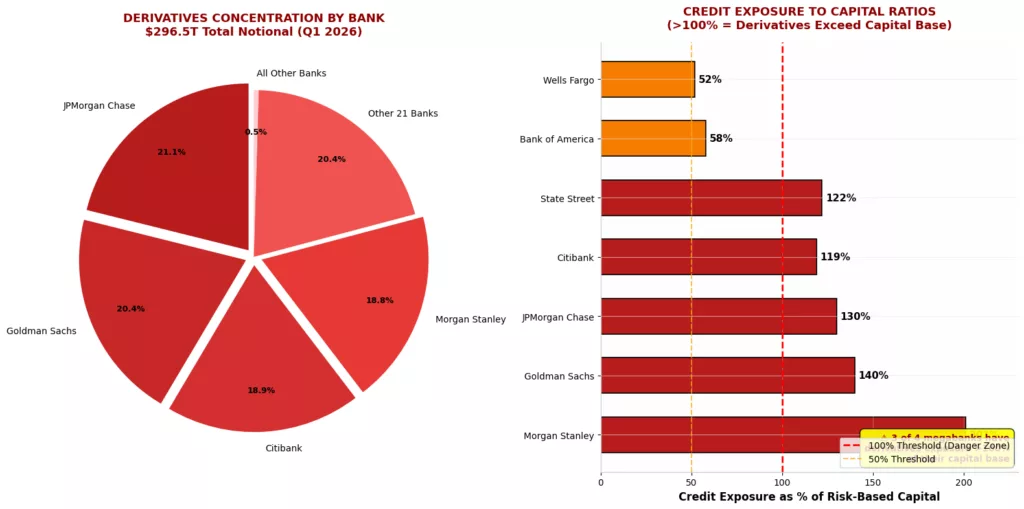
This is not a market. It is a leveraged betting complex that dwarfs the global economy. The concentration is equally striking: four banks control 79.1% of this total. JPMorgan Chase Bank NA holds $62.6 trillion; Goldman Sachs Bank USA, $60.4 trillion; Citibank National Association, $56.0 trillion; and Morgan Stanley Bank NA, $55.6 trillion. The next 21 largest institutions combined hold merely 20.9%, and all other banks—over 1,100 institutions—account for less than 0.5%.
| Bank | Total Derivatives (Q1 2026) | Total Assets | Derivatives/Assets Ratio |
|---|---|---|---|
| JPMorgan Chase Bank NA | $62.6 trillion | \$4.0 trillion | 15.6x |
| Goldman Sachs Bank USA | $60.4 trillion | \$752 billion | 80.3x |
| Citibank NA | $56.0 trillion | \$1.9 trillion | 29.5x |
| Morgan Stanley Bank NA | $55.6 trillion | \$391 billion | 142.2x |
Morgan Stanley’s derivatives book is 142 times its total assets. Goldman Sachs operates at 80x. These are not banks in any traditional sense—they are derivatives trading houses with small banking operations attached. The $391 billion in assets at Morgan Stanley Bank underwrites a $55.6 trillion derivatives portfolio. The notion that these institutions could ever honour their derivative obligations in a systemic stress event is a regulatory fiction maintained through accounting conventions and central bank backstops.
Concentration of this exposure defies any reasonable conception of competitive markets or systemic resilience. Four institutions—JPMorgan Chase Bank NA, Goldman Sachs Bank USA, Citibank National Association, and Morgan Stanley Bank NA—collectively hold seventy-nine point one per cent of all bank derivatives. JPMorgan alone carries sixty-two point six trillion dollars in derivatives against four trillion dollars in total assets, a ratio of fifteen point six to one. Goldman Sachs operates with sixty point four trillion in derivatives against seven hundred fifty-two billion in assets, a ratio of eighty point three to one. Citibank holds fifty-six trillion against one point nine trillion in assets, yielding twenty-nine point five to one. And Morgan Stanley Bank NA, perhaps the most extreme case in the entire banking system, maintains fifty-five point six trillion in derivatives against merely three hundred ninety-one billion in assets—a ratio of one hundred forty-two point two to one. These institutions are not banks in any meaningful historical or functional sense. They are derivatives trading conglomerates with small banking operations attached, operating under regulatory charters that grant them access to deposit insurance, discount window borrowing, and the implicit guarantee of taxpayer-backed bailout.
Risk Metrics: The Netting Illusion: Why “Net” Exposure Misleads
The OCC reports that legally enforceable netting agreements reduced GPFV by 88.9%, leaving NCCE of “only” $325 billion. This framing assumes conditions that systematically fail during crises: Counterparty survival is presumed; Procyclicality of collateral; “Level 3” asset valuation with internal models without marked-to-market reality.
Counterparty solvency is presumed. Netting requires that all parties to agreements remain solvent. In a systemic crisis, counterparties fail simultaneously. The legal certainty of netting evaporated in practice during the Lehman Brothers bankruptcy in 2008, where the theoretical protections of master netting agreements collided with the operational reality of bankruptcy proceedings across multiple jurisdictions. What works in a courtroom simulation fails when the counterparty is in receivership.
Collateral is procyclical. Banks report holding collateral valued at 139.6% of NCCE in Q1 2026 (down from 147.8% in Q4 2025). But collateral is typically posted as cash, Treasuries, or equities. In a crisis:
- Cash collateral becomes scarce as liquidity freezes
- Treasury values fluctuate violently with flight-to-quality dynamics
- Equity collateral collapses precisely when needed most
The March 2020 COVID crash demonstrated this mechanism: the VIX spiked above 80, collateral calls cascaded through the system, and the Federal Reserve was forced to inject trillions to prevent a derivatives-driven meltdown. The OCC’s own data shows the Q1 2020 NCCE spike to approximately $600 billion as markets reacted to pandemic fears—collateral that existed on paper became impossible to realise without central bank intervention.
The “Level 3” problem. Level 3 trading assets, those valued using unobservable inputs and internal models, totalled $44 billion in Q1 2026, up 24.5% from the previous quarter and 29.5% year-over-year. These are the illiquid, complex positions that banks mark themselves. In stress, they cannot be sold at anything approaching model values. The 2008 peak was $204 billion; the current lower level reflects not reduced risk but the migration of these exposures off balance sheet into structured vehicles and non-bank affiliates. Level Three trading assets—those valued using unobservable inputs and internal models rather than market prices—totalled forty-four billion dollars in the first quarter of 2026, up twenty-four point five percent from the previous quarter and twenty-nine point five per cent year-over-year. These assets peaked at two hundred four billion dollars at the end of 2008 and have declined primarily because banks learned to move exposures off balance sheet rather than because the underlying risk disappeared. Level Three assets are particularly dangerous because they cannot be sold at anything approaching model values during stress, yet they contribute to reported capital and earnings. The twenty-four point five percent quarterly increase suggests banks are accumulating illiquid, complex positions that will prove impossible to exit in a crisis.
The risk metrics that regulators prefer to emphasise tell a more nuanced but equally troubling story. Net Current Credit Exposure, which the OCC uses as its primary credit risk metric for derivative activities, increased by eighty-four point one billion dollars in the first quarter of 2026 to reach three hundred twenty-five billion dollars, a thirty-four point eight per cent quarter-over-quarter surge. This metric represents the net amount banks are owed by counterparties after legally enforceable netting agreements are applied. Gross Positive Fair Value, measuring what banks are contractually owed before netting, jumped seven hundred thirty-four billion dollars to two point nine trillion, driven by a four hundred nine billion dollar increase in interest rate receivables and a two hundred twenty-eight billion dollar increase in foreign exchange receivables. Gross Negative Fair Value, what banks owe to others, rose six hundred eighty-five billion dollars to two point eight trillion. Total Credit Exposure, combining NCCE with Potential Future Exposure, stands at one point one four trillion dollars.
The netting benefit—the reduction in exposure achieved through bilateral netting agreements—was reported at eighty-eight point nine per cent in the first quarter of 2026, meaning regulators and banks claim that legal arrangements reduce gross exposure by nearly nine-tenths. This figure is the foundation of regulatory comfort and the basis for capital requirements that many critics argue are dangerously inadequate. The logic proceeds that because banks have master netting agreements with counterparties, and because these agreements are legally enforceable, the true risk is only the net amount remaining after offsetting positive and negative positions. This logic holds under specific conditions that systematically fail during systemic stress. Netting assumes that all counterparties survive to honour their obligations. It assumes that collateral posted remains valuable and liquid precisely when it is most needed. It assumes that legal enforceability translates into operational reality across multiple jurisdictions simultaneously. Each of these assumptions failed during the Lehman Brothers bankruptcy in 2008, where the theoretical protections of master netting agreements collided with the operational chaos of cross-border insolvency proceedings, creating uncertainty that froze markets and forced extraordinary central bank intervention.
The OTC Leverage Catastrophe: Four Banks, One Failure Point
The OCC explicitly acknowledges: “A small group of large financial institutions continues to dominate trading and derivatives activity.” This is not a competitive market. It is an oligopoly of systemic risk with no redundancy. The top 4 banks hold: 79.1% of total notional derivatives (down from 85.1% in Q4 2025 due to the overall market expansion), 65.6% of industry net current credit exposure, and the vast majority of credit default swaps ($5.2 trillion notional).
The interconnectedness is total. JPMorgan’s largest counterparties include Goldman Sachs, Citibank, and Morgan Stanley. Each is simultaneously a creditor and debtor to the others through thousands of netting sets. If any one fails, the others face immediate insolvency through counterparty exposure. This is not theoretical—it is the precise dynamic that forced the AIG bailout in 2008, when a single insurer’s derivatives book threatened to cascade through the entire system. Today’s concentrations are multiples larger.
Credit Derivatives: The Subprime of 2026
Credit derivatives notional amounts surged to $6.7 trillion in Q1 2026, up 32% quarter-over-quarter from $5.0 trillion. The composition reveals the risk concentration: Credit Default Swaps: $5.2 trillion (78.0% of credit derivatives), Credit Options: $668 billion (13.0%), Total Return Swaps: $451 billion (6.8%), Other Credit Derivatives: $147 billion (2.2%). Sub-investment-grade: $2.4 trillion (35.8%).
The sub-investment-grade portion is the powder keg. These reference entities include the distressed corporate borrowers that populate the $2+ trillion private credit market—loans to companies already operating with leveraged balance sheets and limited covenant protection. The OCC reports that 124 banks net sold credit protection (assuming credit risk) totalling $3.2 trillion, while 106 banks net purchased protection (hedging credit risk) totalling $3.5 trillion. The largest dealers—JPMorgan, Goldman, Citibank, Morgan Stanley—dominate both sides.
This creates the “hedge” illusion: banks report that they are protected because they both buy and sell CDS. JPMorgan shows approximately $2.0 trillion in credit derivatives “purchased” and comparable amounts “sold.” In normal times, these net out. In a crisis: The protection you sold is called, but the counterparty is not liquid. The protection you bought is from a counterparty that may be bankrupt; you may never collect. The “hedge” becomes a double exposure. This was the 2008 experience. Banks that were “hedged” via CDS found their hedges worthless because their counterparties (AIG, monoline insurers) failed. The OCC’s data shows this risk remains structurally unchanged. The OCC reports that one hundred twenty-four banks net sold credit protection totalling three point two trillion dollars, while one hundred six banks net purchased protection totalling three point five trillion dollars. The largest dealers dominate both sides of this market, creating the appearance of hedged positions that may prove illusory in crisis. When a bank both buys and sells protection on similar reference entities, it reports a net exposure that appears manageable. But the protection purchased is only as reliable as the counterparty providing it. If that counterparty fails, the hedge becomes worthless while the protection sold remains a direct obligation. This was precisely the dynamic that destroyed supposedly hedged positions in 2008, when banks found their credit default swap protections from AIG and monoline insurers worthless because those counterparties had insufficient capital to honour their obligations. The current data suggests this structural vulnerability remains entirely unaddressed.
Interest Rates Swap Derivatives Market Critical Risk
Interest rate derivatives dominate the market at $203.2 trillion (68.5% of total notional). This concentration is the direct consequence of fifteen years of zero interest rates and quantitative easing, during which banks loaded up on interest rate swaps to hedge bond portfolios, mortgage books, and trading positions. The breakdown by instrument: Interest rate swaps: $183.3 trillion (61.8% of all derivatives), Futures and forwards: $51.9 trillion, Options: $54.7 trillion. Every basis point move in rates creates billions in mark-to-market changes. The Q1 2026 report shows GPFV on interest rate contracts at $1.7 trillion—up 31.6% in a single quarter. This is not stability. It is a leveraged bet on rates that has grown increasingly volatile as the Federal Reserve maintains elevated policy rates. The maturity structure compounds the risk. Short-dated contracts (<1 year) dominate interest rate notional amounts, creating a constant rollover requirement that forces banks to re-establish positions in potentially adverse market conditions. The Q1 2026 data shows $127.1 trillion in interest rate contracts maturing within one year—62% of the total interest rate book.
Interest rate derivatives constitute the overwhelming majority of the market at two hundred three point two trillion dollars, or sixty-eight point five per cent of total notional exposure. This concentration reflects the legacy of fifteen years of near-zero interest rates and quantitative easing, during which banks loaded up on interest rate swaps to hedge bond portfolios, mortgage servicing rights, and trading positions. These instruments assume interest rates remain within manageable ranges, yet rates have risen from near-zero to over five per cent, and the derivatives books have not been reduced—they have grown. Interest rate swaps alone total one hundred eighty-three point three trillion dollars, representing sixty-one point eight per cent of all derivatives. Futures and forwards add fifty-one point nine trillion, and options contribute fifty-four point seven trillion. The maturity structure compounds rollover risk, with one hundred twenty-seven trillion dollars in interest rate contracts maturing within one year—sixty-two per cent of the total interest rate book. This creates a constant requirement to re-establish positions in potentially adverse market conditions, a dynamic that can amplify volatility rather than dampening it.
Trading Revenue: Volatility as Business Model

Bank trading revenue provides the incentive structure behind derivatives expansion. Insured banks reported $16.3 billion in trading revenue in Q1 2026, up 11.4% quarter-over-quarter. The composition reveals the volatility dependence:
| Instrument | Q1 2026 Revenue | Q/Q Change |
|---|---|---|
| Interest rate | $1,132M | -44.7% |
| Foreign exchange | $7,086M | +11.3% |
| Equity | $5,690M | +20.7% |
| Commodity & other | $2,078M | +39.3% |
| Credit | $329M | +915.9% |
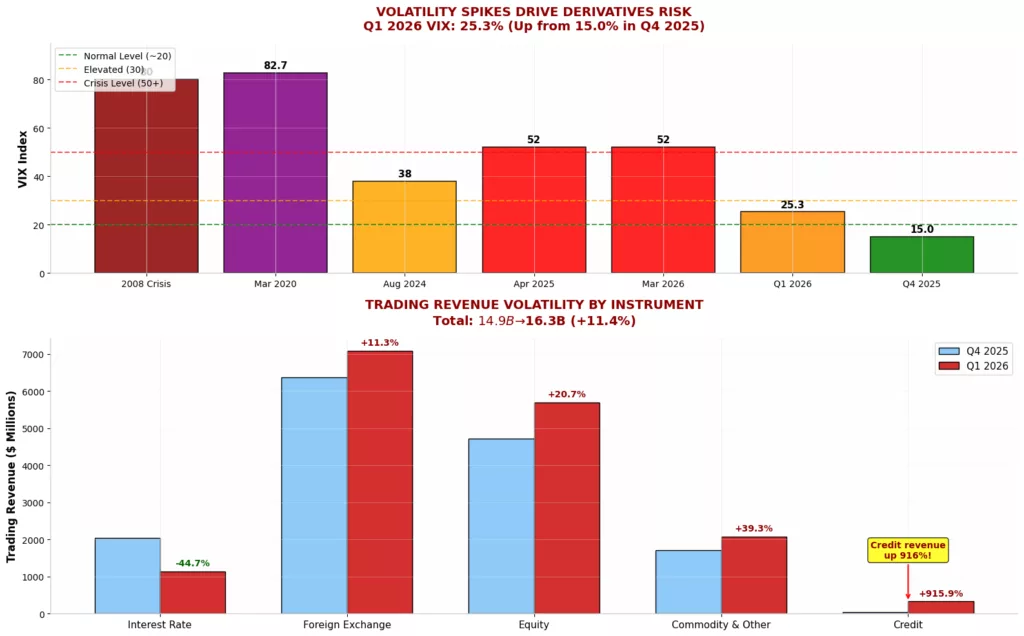
The credit revenue surge (+915.9%) reflects the Q4 2025 baseline of only $32 million—credit trading had nearly ceased. The interest rate collapse (-44.7%) shows how quickly revenue can evaporate when rate volatility moves against positions. At the holding company level, trading revenue was $27.9 billion in Q1 2026, up 13.8% QoQ but down 13.8% year-over-year. The divergence between bank-level and holding company revenue—banks generated 58.6% of consolidated trading revenue—reflects the concentration of riskier activities (commodity, equity, complex credit) in non-bank affiliates that enjoy implicit government backstops without prudential regulation. The “trading revenue to gross revenue” ratio shows how dependent these institutions have become on market-making and positioning:
| Institution | Q1 2026 Ratio |
|---|---|
| JPMorgan Chase Bank NA | 8.70% |
| Bank of America NA | 4.16% |
| Citibank NA | 16.07% |
| Goldman Sachs Bank USA | 11.11% |
Citibank derives one-sixth of its gross revenue from trading. Goldman Sachs, despite its transformation into a bank holding company after 2008, still generates over 11% from trading activities. The trading revenue data reveals how derivatives activity has become central to bank profitability and how volatile that profitability can be. Insured banks reported sixteen point three billion dollars in trading revenue for the first quarter of 2026, an eleven point four per cent increase from the previous quarter but a figure that masks dramatic swings by instrument category. Foreign exchange revenue rose eleven point three per cent to seven billion dollars. Equity revenue jumped twenty point seven per cent to five point seven billion dollars. Commodity and other revenue surged thirty-nine point three per cent to two billion dollars. Credit revenue exploded nine hundred fifteen point nine per cent from a thirty-two million dollar base to three hundred twenty-nine million dollars. But interest rate revenue collapsed forty-four point seven per cent to one point one billion dollars. These swings demonstrate how quickly revenue can evaporate when market movements turn against positions, and how dependent banks have become on trading volatility for income.
Value-at-Risk: The Fiction of Measurable Risk
Banks report Value-at-Risk (VaR) as their primary market risk metric. The Q1 2026 60-day average VaR figures for the four largest trading banks:
| Bank | Q1 2026 VaR | Q4 2025 VaR | Q/Q Change |
|---|---|---|---|
| JPMorgan Chase Bank NA | $168M | $159M | +6.3% |
| Citibank NA | $214M | $168M | +27.4% |
| Bank of America NA | $87M | $78M | +11.5% |
| Goldman Sachs Bank USA | $366M | $218M | +67.9% |
Goldman Sachs’ VaR nearly doubled quarter-over-quarter. The VaR capital requirement for Goldman jumped from $654 million to $1.1 billion—a 67.9% increase that signals dramatically expanded risk positions. Yet VaR is famously inadequate. It measures the maximum expected loss at 99% confidence over 10 business days—assuming normal market conditions. It does not capture tail risk, liquidity freezes, or the correlation breakdowns that characterise crises. The OCC notes that “market risk in trading operations, as measured by VaR, is a small proportion of their risk-based capital.” This is meant to be reassuring. It means the capital charge does not reflect the actual risk.
Central Clearing is always an Incomplete Progress.
The post-2008 push toward central clearing has achieved only partial success. In Q1 2026, 31.6% of bank derivative holdings were centrally cleared, down from 32.6% in Q4 2025. The variation by asset class is stark:
| Asset Class | Centrally Cleared (Q1 2026) |
|---|---|
| Interest rate | 41.6% |
| Foreign exchange | 3.9% |
| Equity | 26.3% |
| Precious metals | 19.2% |
| Credit | 29.0% |
| Other | 18.7% |
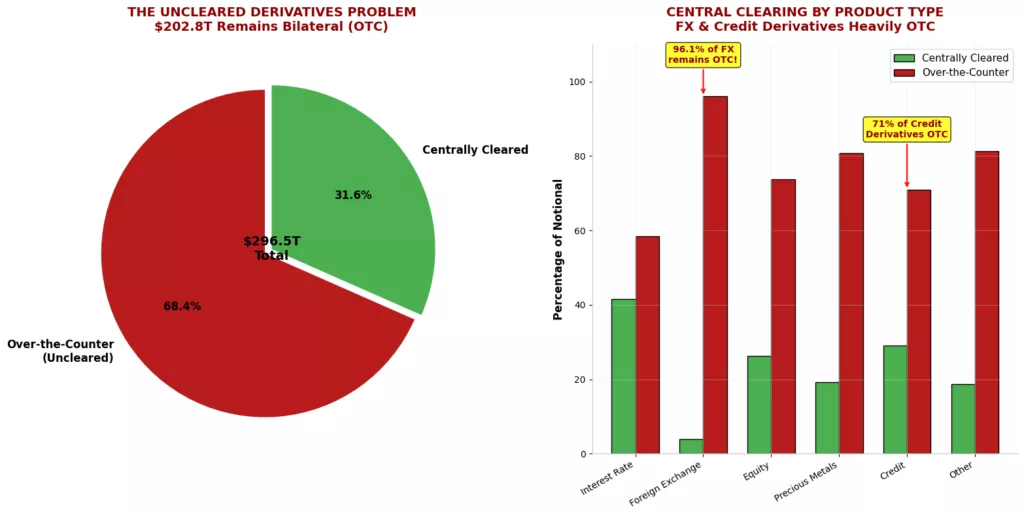
Nearly 70% of derivatives remain bilaterally cleared—meaning banks face each other directly without a central counterparty to absorb default. The FX market is almost entirely uncleared (3.9%). Credit derivatives, the instruments that amplified the 2008 crisis, remain 71% uncleared. The concentration at qualifying central counterparties (QCCPs) creates its own systemic risk. If a major QCCP fails, the clearing “solution” becomes the problem.
Stress Test Scenarios of Systemic Breakdown
The Private Credit Detonation: The $2.0 trillion private credit market, illiquid, sub-investment-grade loans held by BDCs, insurers, and private debt funds, represents the most likely trigger. When defaults rise: CDS othese referencece entititriggerere; banks that sold protection face massive payouts; “Hedged” positions prove worthless as counterparties fail. The $6.7 trillion credit derivatives market becomes a daisy chain.
Interest Rate Shock: A spike in long-term Treasury yields above 6-7% would destroy value in the $203 trillion interest rate book, Trigger margin calls across the system, and force fire sales of collateral, creating feedback loops, as in the Q1 2026 GPFV surge (+31.6% in one quarter) previews this dynamic.
The Counterparty Cascade: Failure of any top-4 bank would make derivatives contracts unenforceable, with counterparties with trillions in unhedged exposures, forcing liquidation that triggers further margin calls; money markets shock and awe freeze the system within days.
Why Systemic Risk exceeds 2008
| Factor | 2008 | 2026 |
|---|---|---|
| Total derivatives notional | $175.0 trillion | $296.0 trillion |
| Top 4 bank concentration | High | Higher (79.1%) |
| Interest rate environment | Rates falling (Fed cutting) | Rates elevated, volatile |
| Central bank ammunition | Fed funds 5.25%, room to cut | Fed funds ~5%, limited room |
| Fiscal capacity | Federal debt 65% of GDP | Federal debt 120%+ of GDP |
| Private credit market | Minimal | $2.0+ trillion, opaque |
| AI/debt bubble | Did not exist | $1.0+ trillion data centre debt |
The comparison between 2008 and 2026 reveals a system that is larger, more concentrated, and less resilient despite fifteen years of regulatory reform. Total derivatives notional has grown from one hundred seventy-five trillion to two hundred ninety-six trillion dollars. Top-four bank concentration has increased from high to higher. The interest rate environment has shifted from falling rates with room for Federal Reserve cuts to elevated, volatile rates with limited policy space. Central bank ammunition has been depleted: the Federal Reserve’s balance sheet remains bloated from prior asset purchases, and the federal funds rate near five percent provides less than half the cutting room available in 2008. Fiscal capacity has been exhausted, with federal debt exceeding one hundred twenty percent of GDP compared to sixty-five percent in 2008. The private credit market, essentially nonexistent in 2008, now exceeds two trillion dollars in opaque, leveraged lending. And the artificial intelligence and data center debt bubble, which did not exist in 2008, now contributes over one trillion dollars in speculative borrowing that may accelerate any downturn.
The regulatory response to these conditions has been inadequate by design. The Dodd-Frank Act mandated central clearing, margin requirements, and enhanced prudential standards. But the implementation has been captured by the institutions it was meant to constrain. Clearing mandates apply only to standardised contracts, leaving the vast majority of foreign exchange and much of the credit derivatives market uncleared. Margin requirements for uncleared swaps were implemented but set at levels that banks can meet through rehypothecation of existing collateral rather than through genuine risk reduction. Stress testing exercises assume orderly market conditions that have never prevailed during actual crises. And the living will resolution planning process has produced documents that regulators privately acknowledge would be unworkable in a real failure. The semantic framework of risk management itself has become part of the problem. Terms like netting benefit, collateral coverage, value-at-risk, and potential future exposure sound like scientific measurements of controllable quantities. They are actually accounting conventions that assume stable correlations, liquid markets, and solvent counterparties—conditions that prevail precisely when they are not needed, and fail precisely when they are. The OCC report discusses these metrics with the clinical detachment of a medical textbook, never acknowledging that the patient is exhibiting symptoms of terminal disease. The political economy of derivatives regulation ensures that meaningful reform remains unlikely. The four largest derivatives dealers are among the most politically powerful institutions in the United States. They contribute to campaigns, employ former regulators, fund academic research, and shape public discourse through media ownership and advertising. They are too big to fail, too complex to resolve, and too connected to regulate effectively. The occasional fines for misconduct—never approaching the scale of profits generated by the misconduct—serve as the cost of doing business rather than deterrents to risk-taking.
The private credit market represents the most probable financial crisis cascading risk because it combines all the elements that produced the 2008 subprime crisis: opacity that prevents accurate risk assessment, leverage that amplifies losses, self-dealing valuation that masks deterioration until sudden collapse, and direct linkage to bank derivatives books through credit default swaps and total return swaps. The two point four trillion dollars in sub-investment-grade credit derivatives references borrowers who are already financially stressed, operating in an economy where interest rates have risen dramatically, consumer savings have been depleted, and corporate profit margins are compressing. When these borrowers default, the credit default swaps trigger, and the banks that sold protection must pay. The banks that bought protection from failing counterparties find themselves unhedged. The daisy chain that followed subprime mortgages in 2008 follows private credit in the 2020s. Meanwhile The interest rate derivatives complex represents a parallel vulnerability. Two hundred three trillion dollars in interest rate contracts assume that rate movements remain within ranges that allow hedges to function and positions to be rolled over. But rates have already risen from near-zero to over five percent, and the derivatives books have grown rather than shrunk. Each basis point move creates billions in mark-to-market changes. The thirty-one point six percent quarter-over-quarter increase in interest rate Gross Positive Fair Value—to one point seven trillion dollars—shows how quickly exposure can expand when rate volatility increases. A sustained spike in long-term Treasury yields above six or seven percent, driven by inflation expectations or sovereign debt concerns, would destroy the value of rate-sensitive derivatives and trigger the margin call cascade that derivatives dealers fear most.
The OCC’s quarterly reports provide transparency without accountability. The numbers are published, examined by specialists, filed away, and ignored by policymakers who have neither the will nor the structural capacity to address the systemic risk they document. Meanwhile, the derivatives complex grows larger, more concentrated, and more fragile with each passing quarter. The two hundred ninety-six point five trillion dollar notional exposure recorded in March 2026 will likely be exceeded in subsequent reports. The three hundred twenty-five billion dollar Net Current Credit Exposure will fluctuate with market conditions but trend upward as the underlying positions expand. The eighty-eight point nine percent netting benefit will be cited as evidence of safety until the moment it fails. The financial system that emerged from the 2008 crisis was supposed to be safer, simpler, and more resilient. The derivatives data through the first quarter of 2026 demonstrates that it is none of these things. It is larger, more complex, more concentrated, and more dependent on central bank intervention than at any point in history. The institutions that control it have become too big to fail, too complex to resolve, and too politically powerful to reform. The regulators who oversee them have become captured by the technical complexity they are meant to master, substituting measurement for management and disclosure for action. And the public that ultimately guarantees the system through deposit insurance and taxpayer-funded bailouts remains largely unaware of the scale of risk being accumulated in its name.
When the next crisis arrives, the derivatives data will be cited as evidence that warning signs were visible. Regulators will claim they lacked authority to act. Policymakers will insist they were surprised by the speed of contagion. And the institutions that created the crisis will demand immediate intervention to prevent systemic collapse, threatening economic catastrophe if their demands are not met. The cycle that began with the 2008 bailout and continued through the 2020 pandemic response will repeat at greater scale, further concentrating power, further depleting public resources, and further eroding the legitimacy of financial and political institutions. The two hundred ninety-six trillion dollar derivatives complex is not merely a financial risk. It is a political time bomb, ticking toward detonation with each quarterly report that documents its growth while failing to restrain its danger.