MAJOR POUND STERLING EXCHANGE RATES VOLATILITY STUDY
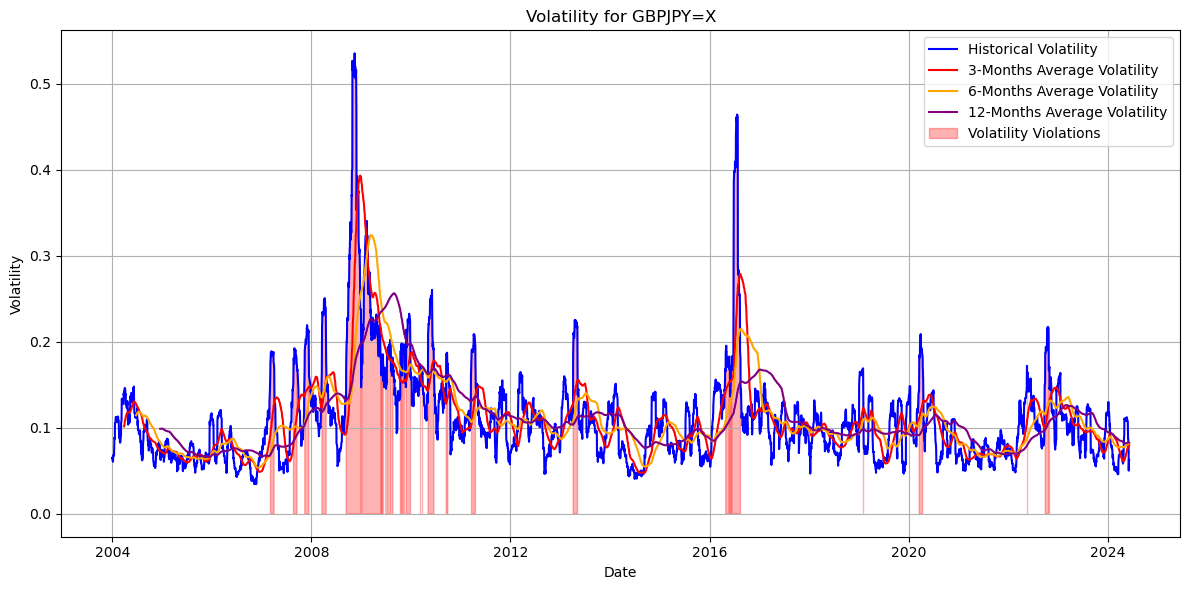
GBP/CHF, GBP/JPY AND GBP/USD GRAPHS OF HISTORICAL VOLATILITY CALCULATED WITH 30 DAYS STDV OF LOG RETURNS, THEN 3-MONTH, 6-MONTH AND 12-MONTH AVERAGE VOLATILITY. THE GRAPHS OF GBP/CHF, GBP/JPY AND GBP/USD SEE THE 3-MONTH AVERAGE VOLATILITY LINE DRIFTING UPWARD TO CROSS…
THE FTSE100 COULD BE ON THE VERGE OF AN EQUITIES MARKET CORRECTION
The FTSE 100 chart on a monthly time scale has seen the Bollinger Band giving to the FTSE 100 price line a Sell Signal, that has been consolidating on the Tenkan and Kijun Line. However, these are not relevant technical…
The S&P 500 is overvalued and a correction would be natural
A macroeconomic interpretation of the Federal Reserve shrinking its balance sheet could be that q(t)=1+C'{I(t)}, the value of one more unit of capital= cost of getting one more unit of capital, as money markets interest rates rise to match inflation…
S&P 500 POTENTIAL -15% SELL-OFF
SPX price/volume, Daily timescale chart, below the 200-day Exponential Moving Average, that means SPX in logarithmic function. Most important SPX 3963 Point of Control SELL-OFF Signal, with a potential Head&Shoulder candlestick pattern. S&P500 price/volume trendline with a -15% | -17.5%…