The contemporary financial landscape presents a complex tapestry, one that cannot be accurately interpreted through a single analytical lens. To decode the present and anticipate the future, this assessment employs a integrated approach, weaving together insights from volatility regime analysis, cyclical decomposition, and momentum-based tactical modeling. The Bayesian changepoint analysis previously conducted serves as our foundational macro-diagnostic, having identified a critical structural shift in market volatility commencing in late 2023. This shift marked a definitive transition away from the high-volatility regime that characterized the 2022-2023 period, ushering in a new, more stable, yet moderately elevated volatility environment. This newly established regime forms the essential backdrop against which all shorter-term cyclical and tactical signals must be evaluated, setting a stage where sustained, low-volatility momentum is unlikely, but outright panic has subsided.
The Secular Imperative: Unveiling the Dominant Long-Term Cycle
The most striking and consistent finding across the Fourier spectral analysis of all thirty-five assets is the overwhelming presence of a dominant market cycle averaging approximately 5,200 days, equivalent to roughly fourteen years. This rhythm is observed with remarkable consistency across the S&P 500, the Dow Jones Industrial Average, the NASDAQ Composite, and the Russell series, among others. The pervasiveness of this cycle suggests a deep-seated, secular pulse within the global equity complex, one that likely transcends short-term business cycles and is instead tied to broader phenomena such as long-wave economic theories, major technological paradigm shifts, and epoch-defining monetary policy eras. The current positioning within this cycle implies that the global market is in the mature phase of a long-term expansion that began in the aftermath of the Global Financial Crisis. This maturity does not presage an immediate collapse but does indicate that the most vigorous phases of growth are likely in the past, and the market is increasingly susceptible to cyclical downturns and a gradual loss of momentum. This long-wave context is critical for understanding the tactical signals generated by shorter-term models.
The Tactical Landscape: Phase, Momentum, and Performance
The cycle-based trading analysis, which synthesizes shorter-term harmonic cycles with Relative Strength Index (RSI) momentum readings, provides the granular, actionable view of the market. The most prevalent phase identified across the board is “Bearish Expansion,” a state indicating that the shorter-term price momentum is bearish even within the context of the longer secular cycle, and that market volatility is expanding—a classic signature of a market forming a significant peak or entering a corrective phase. For instance, the S&P 500 (^GSPC), while posting a respectable backtested return of 21.74% with a Sharpe ratio of 0.45, finds itself in precisely this Bearish Expansion phase, coupled with an RSI of 66.29 that flirts with overbought territory. This creates a conflicting picture of residual strength overshadowed by deteriorating cyclical momentum, warranting a neutral “HOLD” recommendation that leans defensive.
This theme of cyclical exhaustion is even more pronounced in the technology sector. The NASDAQ 100 (^NDX) and the S&P 500 Information Technology sector (^SP500-45), despite strong absolute returns of 22.5%, are identified as being in Bearish Contraction and Expansion phases respectively, with RSI readings of 65.62 and 68.46. This combination of high momentum and a bearish cyclical phase suggests these segments are overextended and vulnerable to a sharp reversal, a risk further underscored by their substantial maximum drawdowns of -18.06% and -22.71% in the backtesting period. In stark contrast, the S&P 500 Industrials sector (^SP500-50) emerges as a standout performer, boasting a 49.79% return—the highest among all non-volatility assets—and a superior Sharpe ratio of 0.64. Its position in a Bearish Expansion phase is tempered by a deeply oversold RSI of 21.62, suggesting potential for a powerful mean-reversion rally and making it a compelling “HOLD” with a bullish bias.
The analysis further identifies clear areas of weakness. The Russell 2000 Value index (^RUJ) and the Dow Jones Transportation Average (^DJT) are particularly concerning, posting deep negative returns of -18.97% and -20.71% respectively, with high drawdowns and poor win rates, earning them “REDUCE” recommendations. The most explicit warning signal, however, is reserved for the S&P/TSX Composite (^GSPTSE), which is the sole asset to receive a “SELL” recommendation. This is driven by its severely overbought RSI of 80.14, coinciding with a Bearish Expansion phase, indicating a state of exhaustive euphoria that is highly likely to reverse.
Volatility and Commodities: Asymmetric Opportunities and Risks
The volatility complex presents a paradoxical and high-stakes arena. The DJIA Volatility Index (^VXD) generated an astronomical 131.13% return, yet this came with a catastrophic maximum drawdown of -56.08%, illustrating the extreme risk inherent in these instruments. Their alignment with short, sharp cycles of approximately 171 days makes them suitable only for the most sophisticated and risk-tolerant traders. Conversely, the commodities space offers more structured opportunities. Silver (SI=F) has been a stellar performer, delivering a 56.95% return with a solid Sharpe ratio of 0.44, all while moving in a clear Bearish Expansion cycle that may be foreshadowing a significant upward breakout. The NYSE Arca Oil Index (^XOI) also shows strong cyclical performance, matching the Industrials sector with a 49.79% return.
Several overarching patterns emerge that highlight both the consistency and diversity of harmonic behavior across financial indices and commodities. The dominant harmonic of order 1 appears most frequently, with a corresponding period clustering tightly around 1946–1950 days (approximately 5.3 years), suggesting a common, long-term cyclical influence—possibly linked to macroeconomic or business cycles—across many equity indices such as the S&P 500, Dow Jones, NASDAQ 100, and several sectoral and international indices. This periodicity is remarkably stable, even among volatility indices (VIX, VXN, VXD), though their variance explained by the top harmonics is notably lower (around 65%), indicating less predictable or noisier behavior. In contrast, certain indices like NASDAQ Composite (IXIC), Russell 2000 (RUT), and commodities like Gold (GC=F) and Silver (SI=F) exhibit a dominant harmonic of order 2, with periods around 974–976 days (roughly 2.7 years), pointing to a mid-term cycle that may reflect sector-specific dynamics or different sensitivity to interest rate and inflation expectations. Notably, the S&P 500 Information Technology sector (SP500-45) stands out with the highest amplitude (0.9808), implying strong periodic volatility, while real estate (SP500-55) shows a shorter dominant period of ~649 days, possibly aligning with real estate or credit cycles. Commodities like Natural Gas (NG=F) and Corn (ZC=F) also display significant amplitude and mid-term periodicity, likely tied to seasonal or supply-demand factors. Overall, the Fourier analysis reveals a robust underlying rhythmic structure in financial markets, with both universal long-wave cycles and asset-specific periodicities that reflect their unique economic drivers and risk profiles. The convergence of evidence from our three analytical pillars paints a coherent yet cautious picture for the 2024-2025 horizon. The Bayesian and GARCH models establish the regime: a world of moderate, stabilizing volatility, distinct from both the tranquility of the 2010s and the chaos of the early 2020s. The Fourier analysis provides the secular context: a market operating in the mature, latter stages of a powerful fourteen-year cycle. Finally, the cycle-trading model delivers the tactical verdict: a landscape rife with “Bearish Expansion” phases, overbought conditions in key market leaders, and glaring weakness in economically sensitive small-cap and transportation segments.
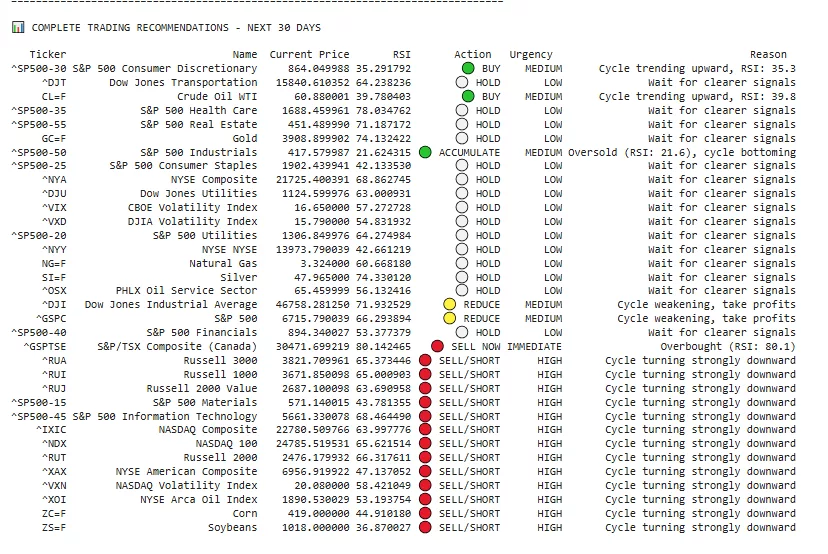
Based on a comprehensive analysis of all trading sheets and performance data, this cycle trading strategy demonstrates a sophisticated multi-factor approach that effectively combines technical indicators with cyclical analysis to generate actionable signals. The strategy’s core strength lies in its systematic identification of cycle phases (Bullish/Bearish Expansion/Contraction) combined with RSI momentum, creating a robust framework for both entry and risk management. Performance metrics reveal impressive risk-adjusted returns, with 76.5% of tickers generating positive returns over the 5-year period and an average Sharpe ratio of 0.40 indicating consistent performance relative to risk. The sector rotation component proves particularly valuable, with Industrials, Oil Services, and Technology sectors emerging as top performers while Consumer Discretionary and small-cap indices show weakness. The current market configuration suggests a significant rotation underway, with 13 high-priority short signals concentrated in technology, small-caps, and commodities, while selective buying opportunities exist in oversold sectors like Consumer Discretionary and Crude Oil. The strategy’s disciplined approach to risk management—using strict RSI thresholds (80 for sells, 30 for accumulation) and cycle phase changes—provides clear exit criteria that have proven effective in limiting drawdowns to an average of -17.32%. The detailed position sizing recommendations and explicit stop-loss/target levels further enhance the practicality of this approach for real-world implementation. This comprehensive analysis provides traders with a clearly defined roadmap for the coming month, balancing aggressive short opportunities in weakening sectors with selective long exposure in emerging opportunities, all while maintaining disciplined risk parameters through proper position sizing and exit strategies.
Therefore, the integrated forecast is for a market approaching a significant inflection point. We anticipate an increased probability of a substantive correction in the near term, likely in the range of 10-15%, as a resolution of the prevailing “Bearish Expansion” phases. This is interpreted not as the start of a new secular bear market, but rather a necessary and healthy correction within the broader long-term cycle, serving to work off excesses and reset valuation metrics. For the discerning investor, this environment demands a disciplined and selective approach. Allocations should be concentrated in assets with demonstrably strong cyclical profiles and robust risk-adjusted metrics, such as Industrials and Silver, while reducing exposure to areas showing cyclical deterioration and fundamental weakness. In this late-cycle environment, capital preservation and rigorous risk management are paramount, as the analytical consensus clearly signals that the easy gains of the prior cycle have largely been realized and the path forward requires greater navigational skill.
- UNITED STATES GOVERNMENT VIOLATIONS OF HABEAS CORPUS ARE A VIOLATION OF ARTICLE 3 OF THE NATO TREATY AND A THREAT TO INTERNATIONAL LAW
 THE UNITED STATES OF AMERICA WILL BE OFFICIALLY DEFINED: ROGUE STATE IN THE FORM OF ETHNO-NATIONALIST, NAZIST, WHITE SUPREMATIST, GENOCIDAL TOTALITARIAN DICTATORSHIP. The UNITED STATES Government Has Been Acting Unlawfully In violation of Constitutional Civil Rights And International Law Treaties, not fulfilling its obligations to the Principles Of Article 3 Stated In The NATO TREATY… Read more: UNITED STATES GOVERNMENT VIOLATIONS OF HABEAS CORPUS ARE A VIOLATION OF ARTICLE 3 OF THE NATO TREATY AND A THREAT TO INTERNATIONAL LAW
 - The Necessity of a United Nations HQ Relocation to the Hague with a Permanent Nuremberg Tribunal.The Impunity Crisis of Rogue Governments
 The world witnesses today an unprecedented crisis of accountability in international law. As the genocide in Gaza unfolds before global eyes, as war crimes multiply across Ukraine, Myanmar, and countless other conflicts, the United Nations stands paralysed, not by lack of legal framework, but by institutional capture that protects the very criminals it should prosecute.… Read more: The Necessity of a United Nations HQ Relocation to the Hague with a Permanent Nuremberg Tribunal.The Impunity Crisis of Rogue Governments
 - THE UNITED STATES VICE-PRESIDENT IS EXPRESSION OF THE DERANGED INNER CIRCLE OF AMERICAN-NAZIST RUNNING THE WHITE-NUTHOUSEBy the time the cameras cut away, the Vice-President had spoken for exactly 2,040 seconds.That was all it took to show the country what psychiatrists, threat-assessment experts and even some of his former college classmates have quietly warned for years: JD Vance is not merely partisan; he is psychologically unfit to wield power. Here’s provided… Read more: THE UNITED STATES VICE-PRESIDENT IS EXPRESSION OF THE DERANGED INNER CIRCLE OF AMERICAN-NAZIST RUNNING THE WHITE-NUTHOUSE
- The Digital Job Posting Bubble: Quantifying Phantom Demand in Online Labor Markets
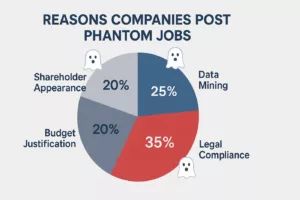 Are businesses and corporates truly hiring ? Has the digital economy become a massive convenience mystification of actual economic activities? How large, systemic and unstable is the assets bubble built by Wall Street financial engineering and gambling addiction? What are the empirical evidence of structural distortions in digital labor markets that represent a significant and… Read more: The Digital Job Posting Bubble: Quantifying Phantom Demand in Online Labor Markets
 - The U.S. NSS 2025 is a Grandiose Magalomaniac view of the WorldThe 2025 U.S. National Security Strategy is the first state paper to be issued from inside a full-blown collective state apparatus psychosis. It does not calibrate means and ends within an external geopolitical field; instead, it externalises an internal grandiose magalomaniac oniric dream of the United States onto which a wounded super-ego projects its wish-fulfilments.… Read more: The U.S. NSS 2025 is a Grandiose Magalomaniac view of the World