Samples of FTSE100 blue chip stocks and the FTSE100 index have been elaborated to understand the stocks’ returns and the index returns since 2010 up to date. A wide variety of descriptive statistics and volatility measures have been assembled, meanwhile, theoretical CAPM and Risk Parity portfolio allocation have been assembled in order to gather the prospective theoretical market returns of portfolio constrained on stocks sampled. Indeed, FTSE100 blue-chip stocks don’t provide a consistent track record of above-average returns, although these stocks carry some consistent volatility risks and drawdown risks, that would make exposure to such stocks a complicated, not for the heart-fainted, task.
The basket of FTSE100 multinationals’ market returns analysed have been as in the list below: Astra Zeneca, Barclay Bank, BP, HSBC, Lloyds Bank, NatWest Group, Royal Dutch&Shell, and the FTSE100 Index as the representative benchmark. Beginning from the basic descriptive statistics data, it has been possible to gather at first glance how all the Stocks do have negative skewness of returns and some high Kurtosis. Negative skewness of returns is a basic parameter that would inform any potential investor that the stock price observed in its stock market random walk does have negatively skewed returns, hence the stock prices studied in this sample have negative returns, although exceptions could be made for Astra Zeneca stock prices returns that have been growing steadily since 2010. Overall the large Kurtosis parameter in Astra Zenece, BP, Shell and the FTSE100 indicate that those stock prices are also prone to larger price moves determined by outlier exogenous factors, which can imply higher stock price volatility.
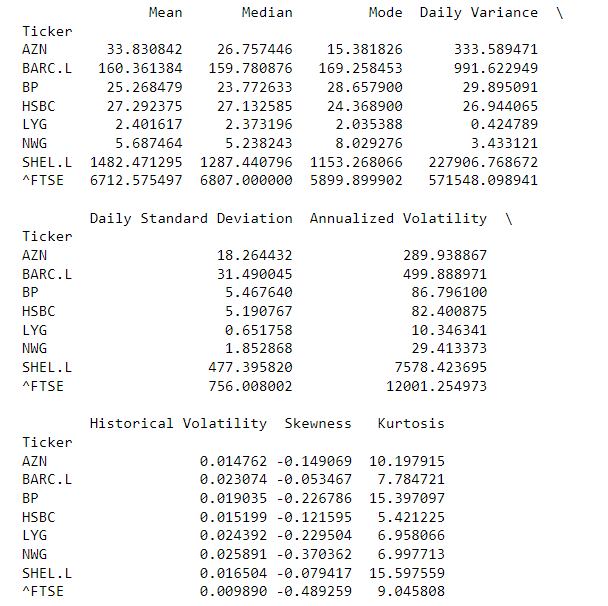
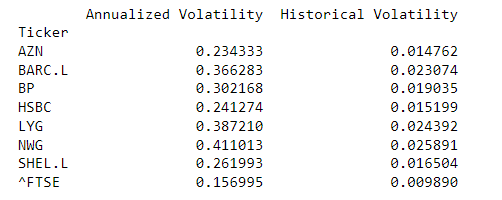
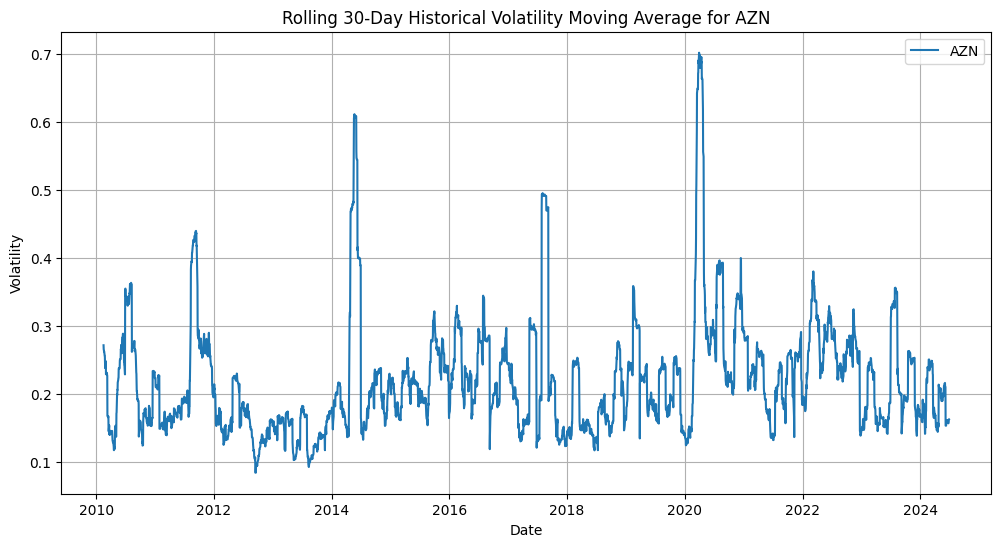
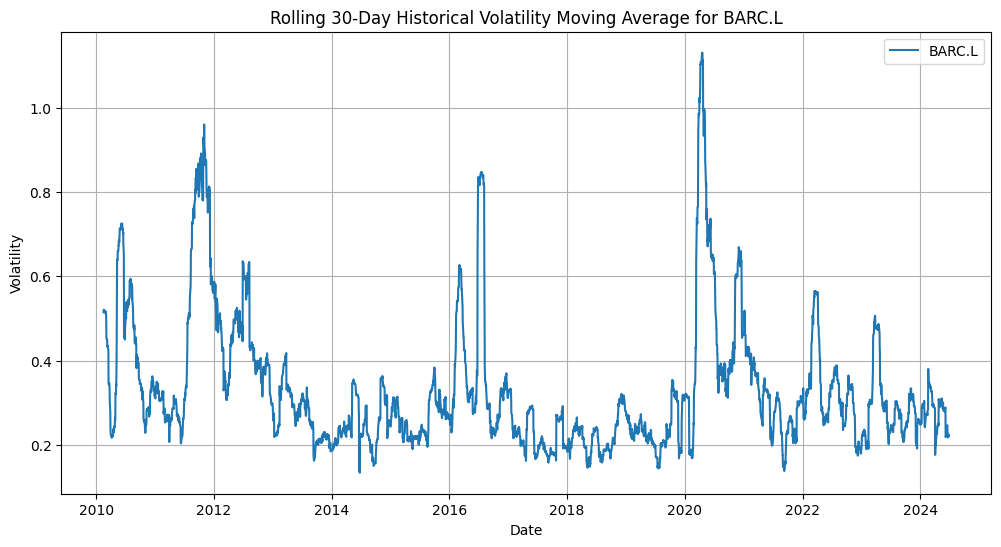
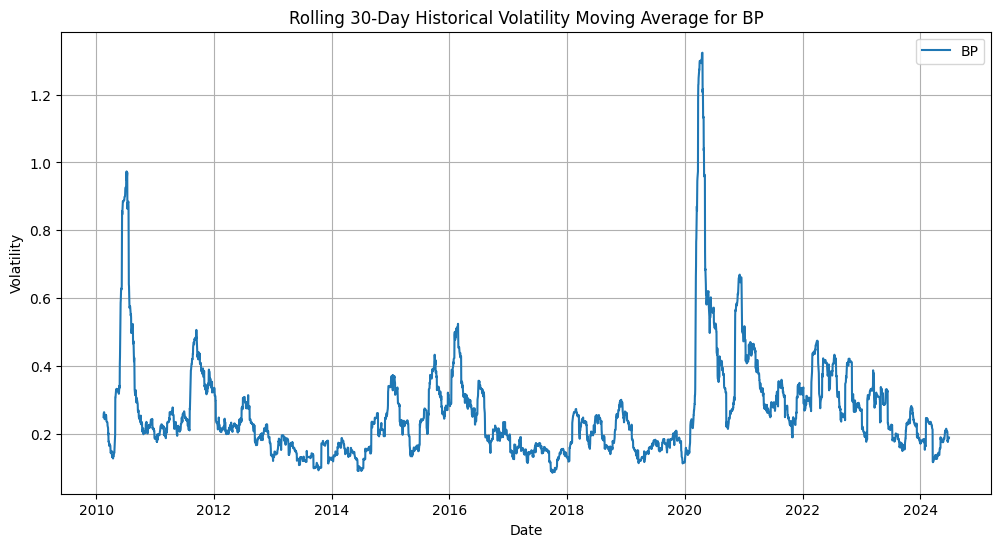
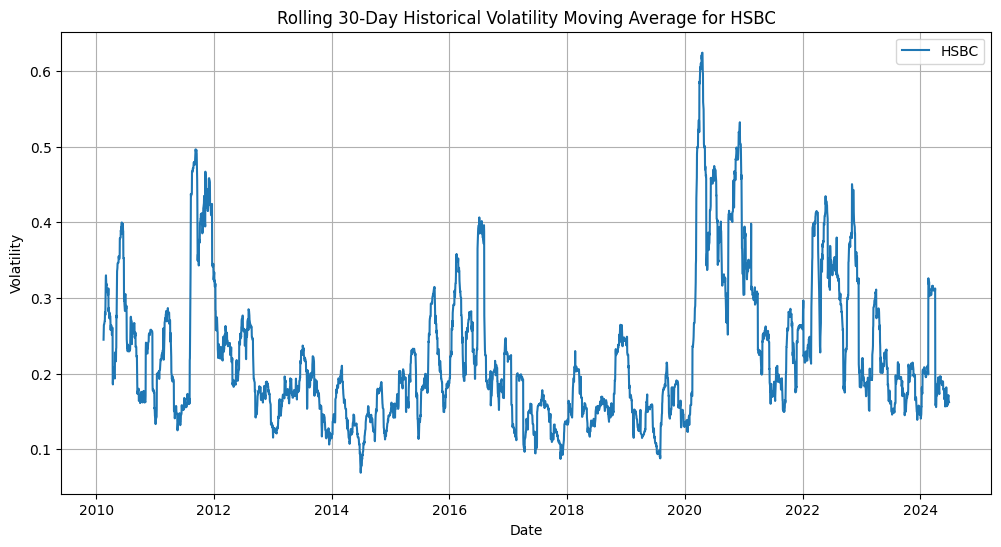
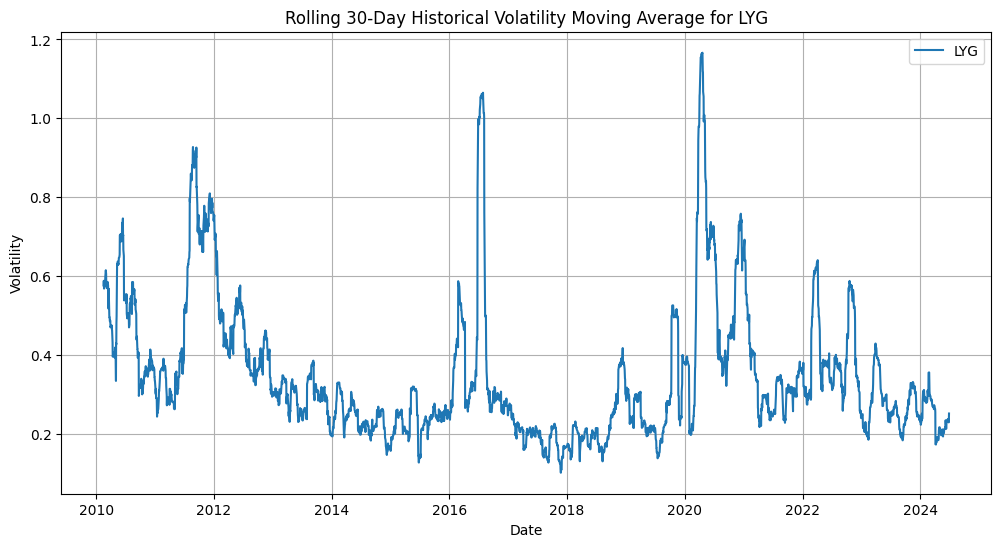
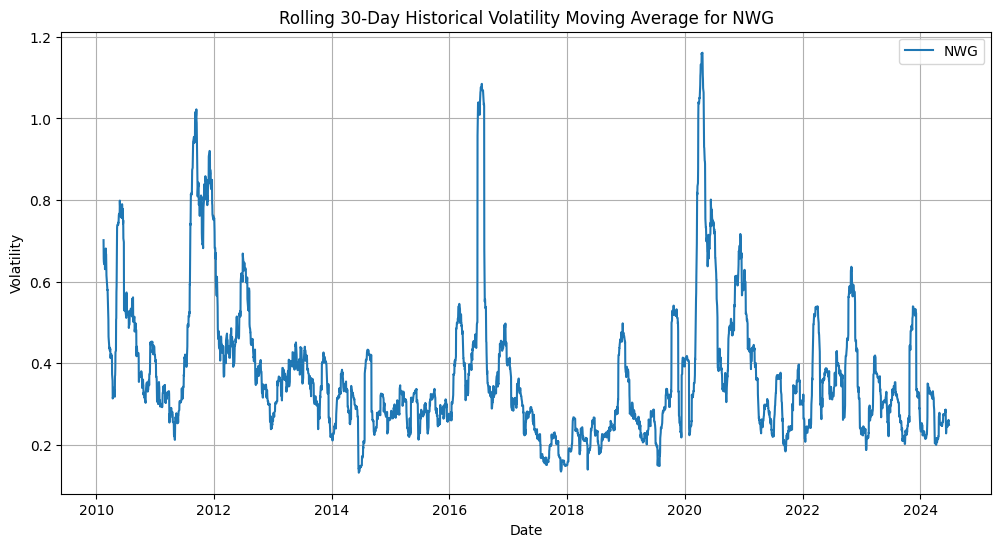
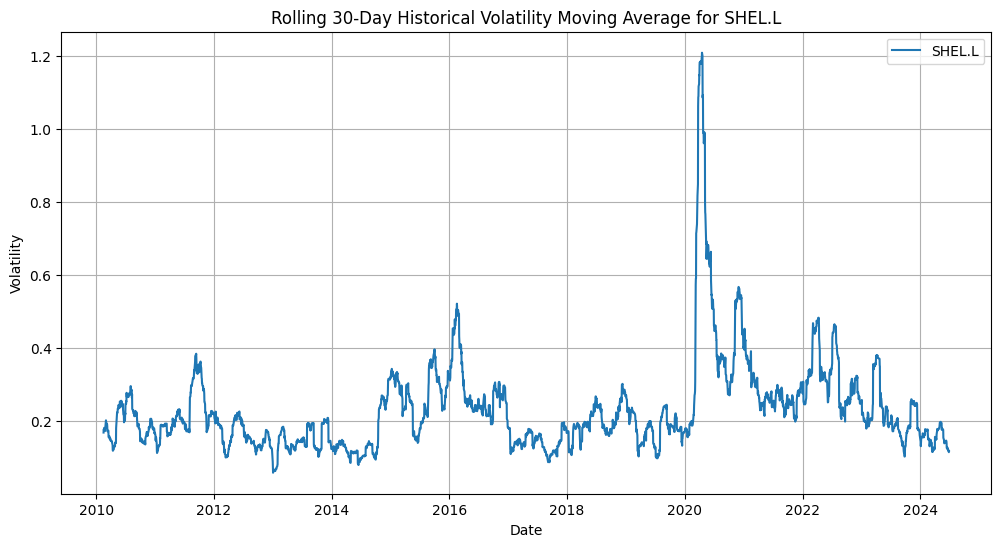
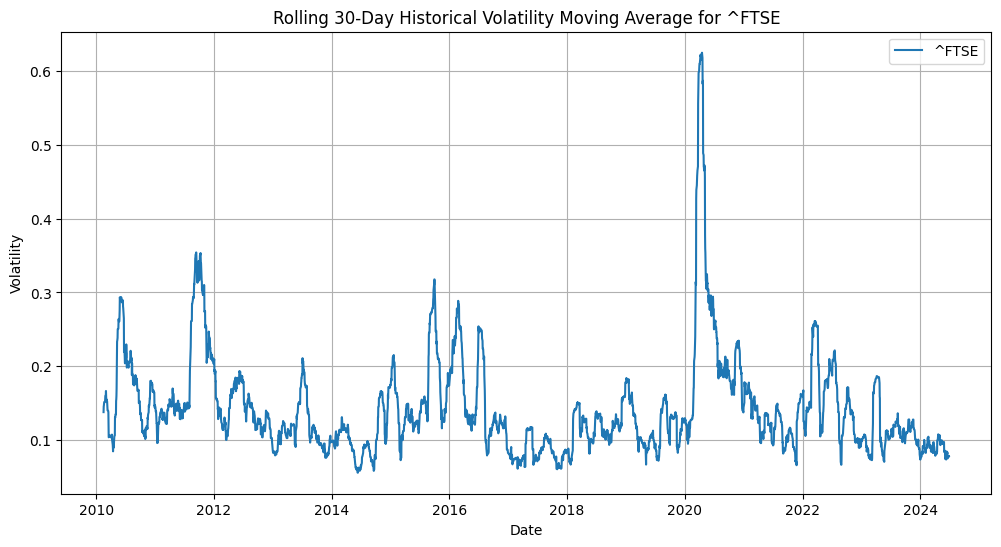
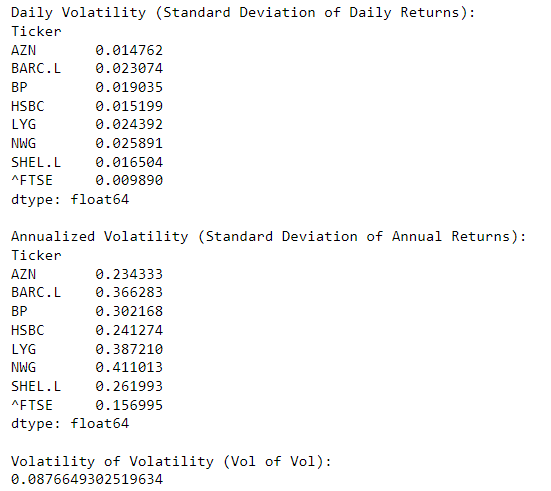
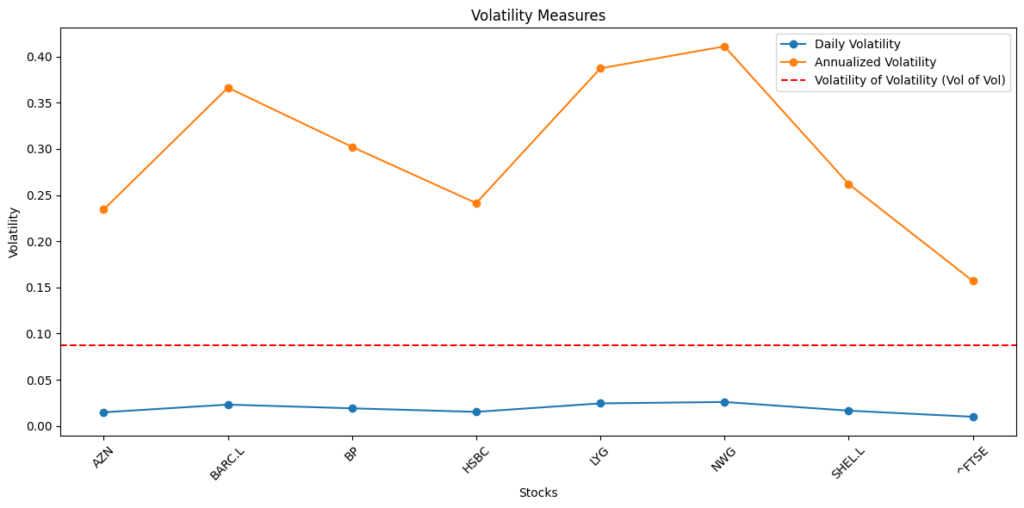
Annualised and historical volatility parameters have been extracted from stocks’ daily returns, based on a 21-day, 30-day standard deviation. The data convey a contained historical volatility, also as a conditional historical volatility as the data considered span from 2010 up to date, but the historical volatility data do give some hints about the higher volatility of bank stocks, such as Barclays, Lloyds Group and NatWest Group. However all stocks do express some large Annualised Volatility parameters above the FSTE100 15.7% annualised vol, these are idiosyncratic market risks of stock prices, but also data to consider in terms of portfolio allocation and the risk-reward of any particular investor for holding these stocks.
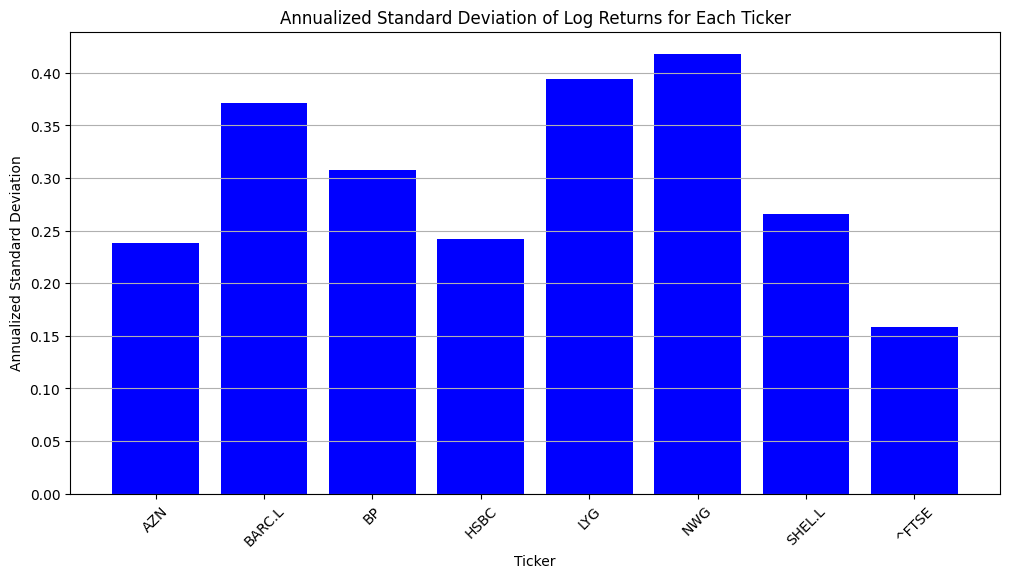
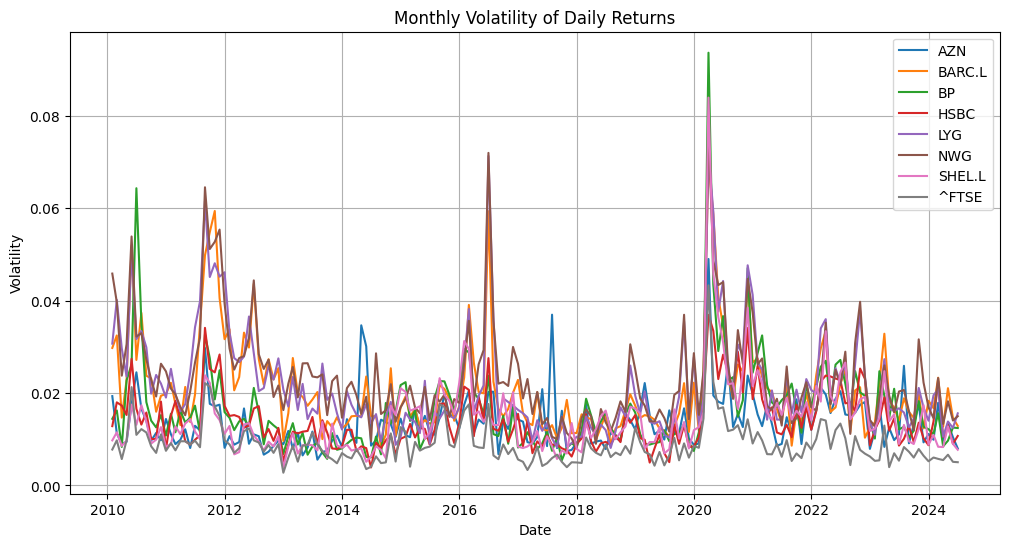
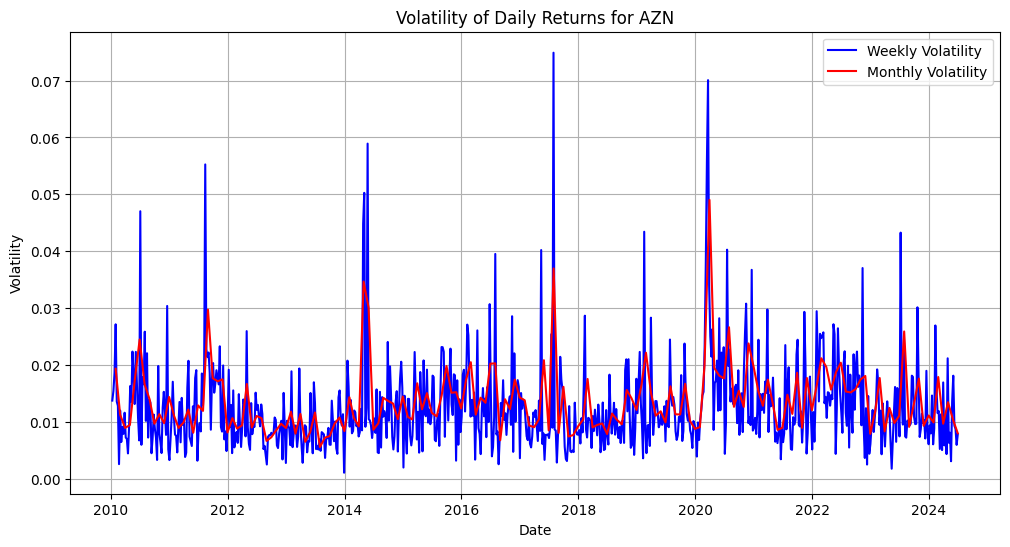
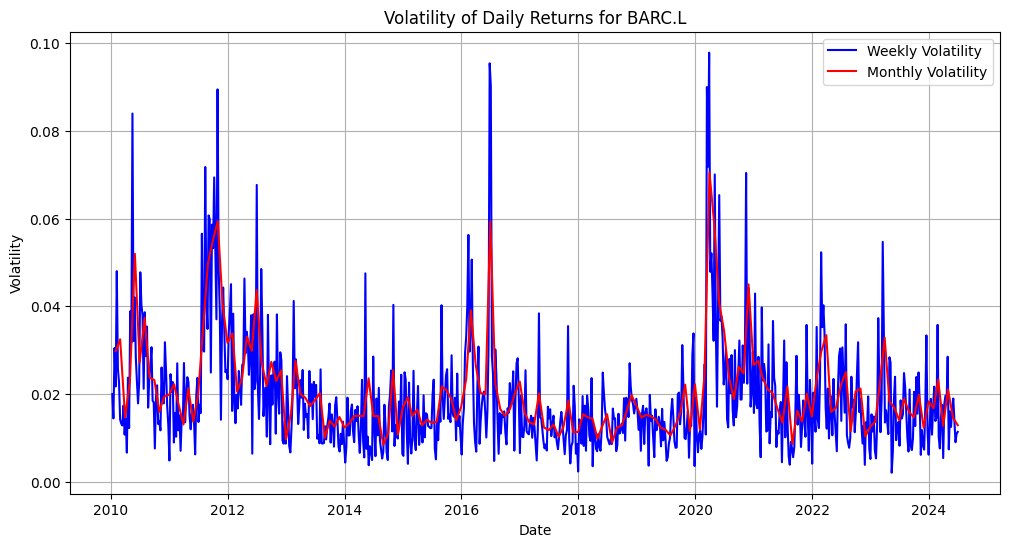
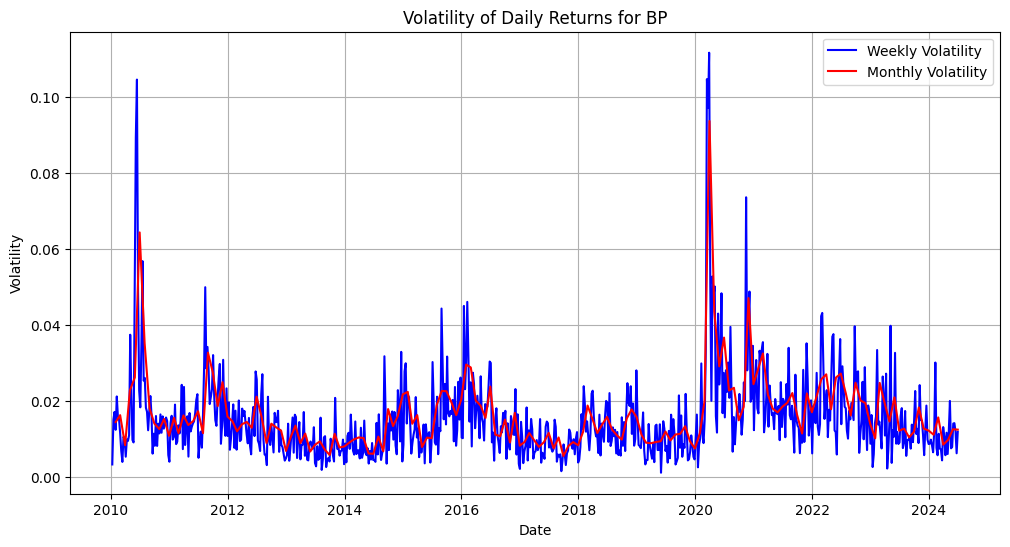
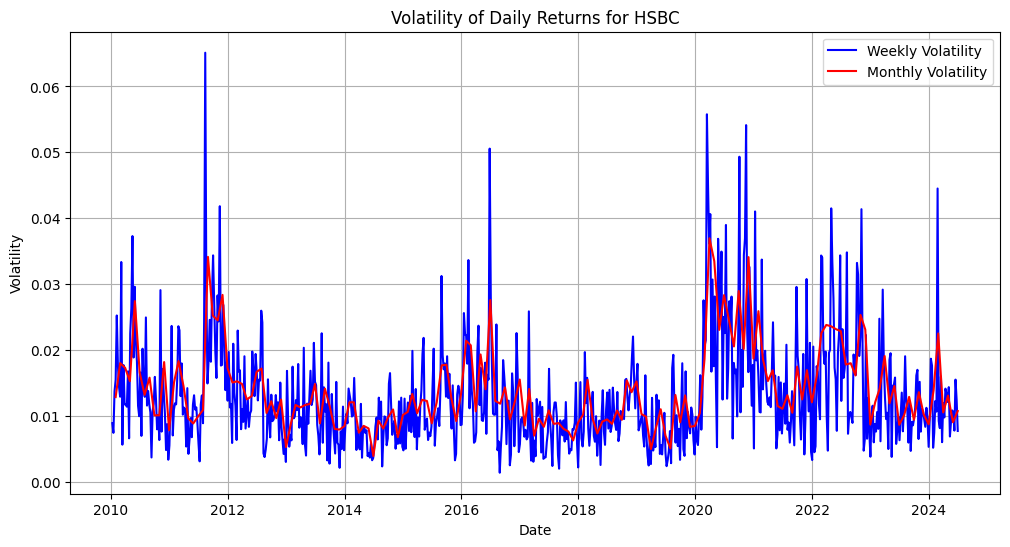
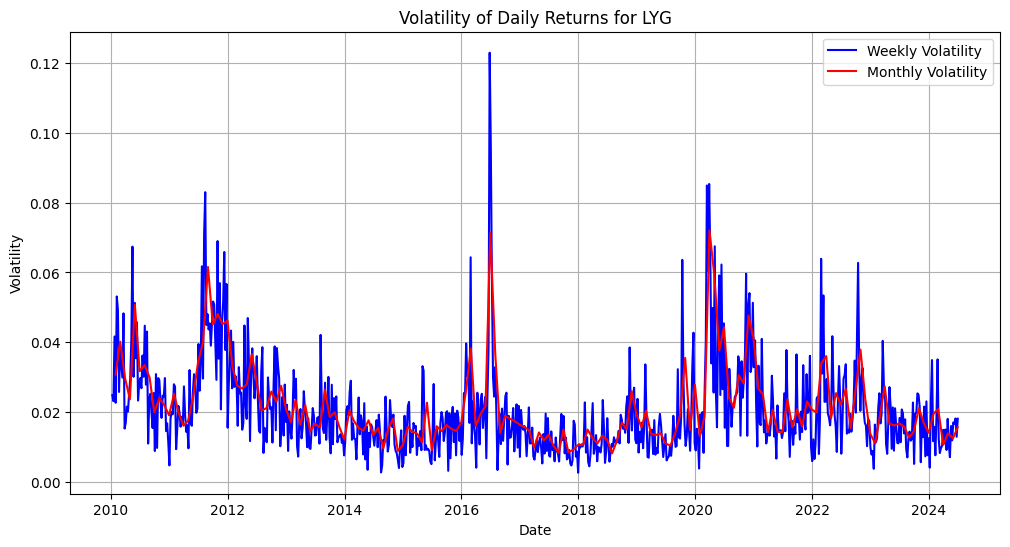
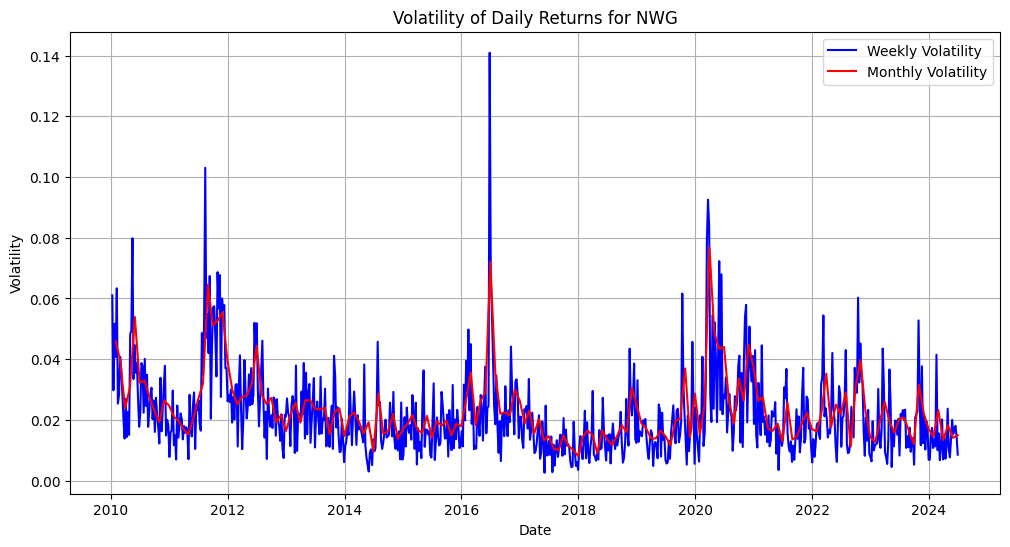
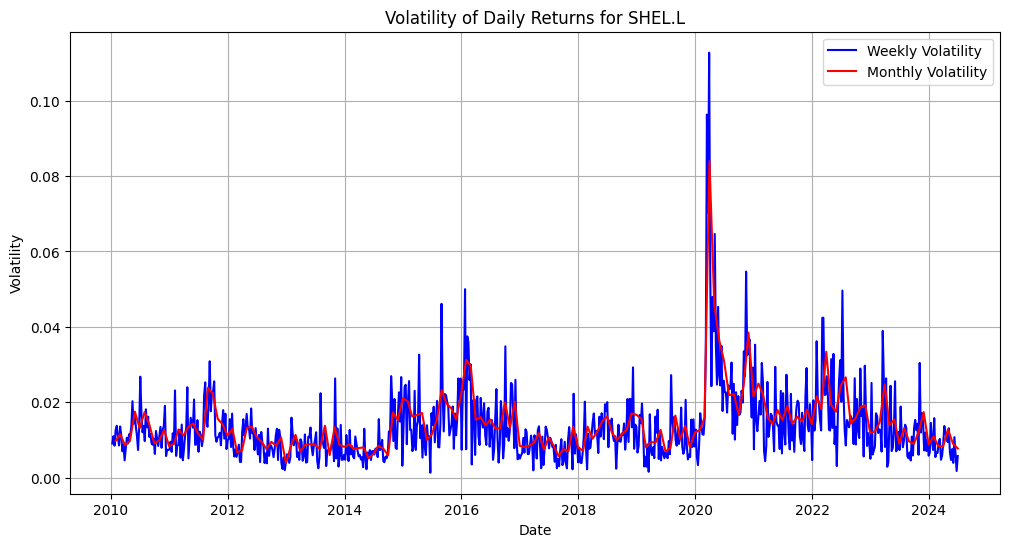
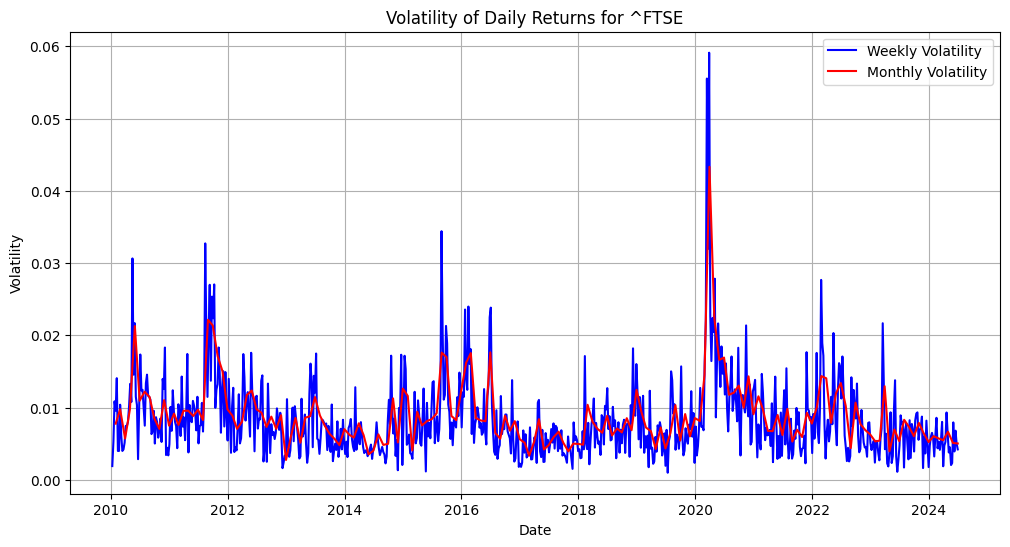
From the graph below it’s possible to observe the 21-day volatility of daily returns and these are mostly contained around 2%, in fact, the average 21-day vol that those seven stocks carry equates to 1.95%, which is larger than the FTSE100 volatility of 1%. However, the average annualised volatility of all seven stocks equates to 31,58% which implies more than double the annualised FTSE100 15.7% vol. However, for all stocks, it’s possible to observe also some clustering phenomena, hence, larger volatility periods are followed by larger volatility periods, and some stocks do have much larger weekly volatility market events, compared to monthly volatility, hence the larger kurtosis parameters hint at some idiosyncratic stocks volatility risks.
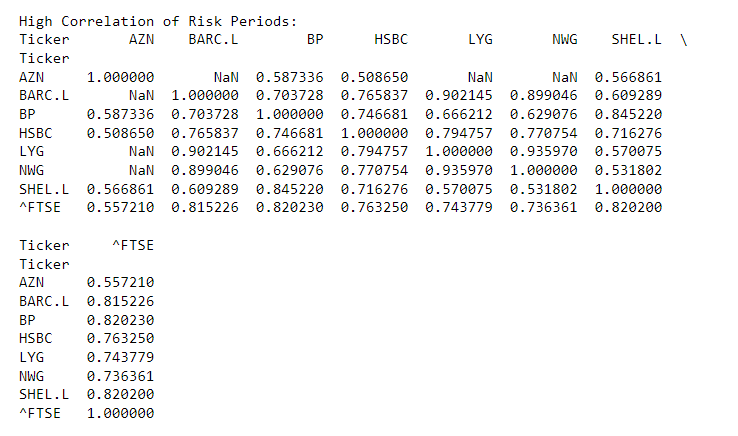
Then the high correlation risk periods have been checked across the stocks and the FTSE100 as well, all stocks result in a positive correlation dynamic, these data have been elaborated on the basis of rolling volatility periods, not based on the classic Pearson square coefficient. Interpolation of volatility parameters has conveyed positive high correlation risks between stocks in terms of market volatility risks, while we can also notice that Shell carries a somewhat moderate volatility correlation with bank stocks such as Lloyds and NatWest Group, making Shell a potential diversifier outside the sample examined.
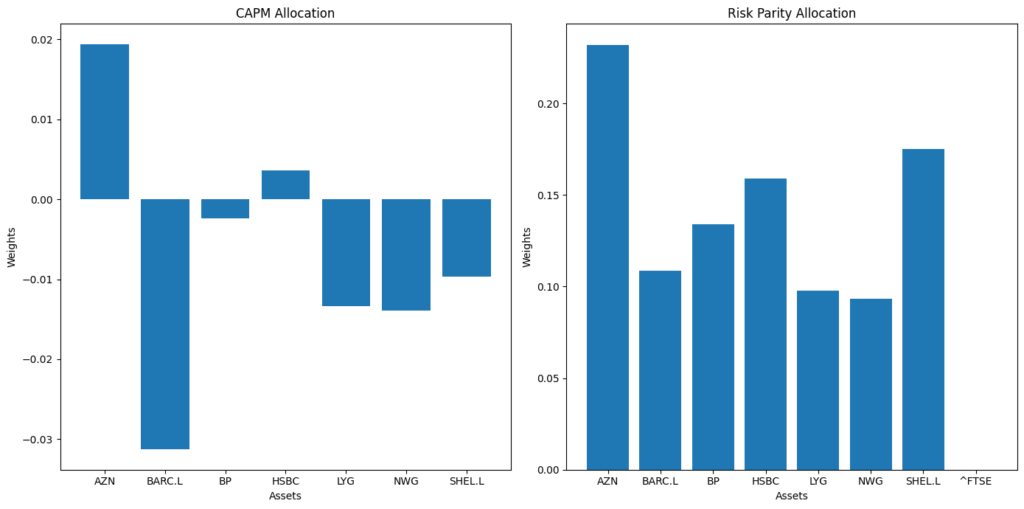
The theoretical CAPM and Risk Parity portfolio allocations are at the antipodes, for it would be convenient to consider the Risk Parity Allocation as a function of the stocks’ beta risk and the market risk, considering that the CAPM model could only allocate positive weights to Astra Zeneca and HSBC, in fact, elaborating an asymmetric strategy by allocating negative weighting to Shell shares.
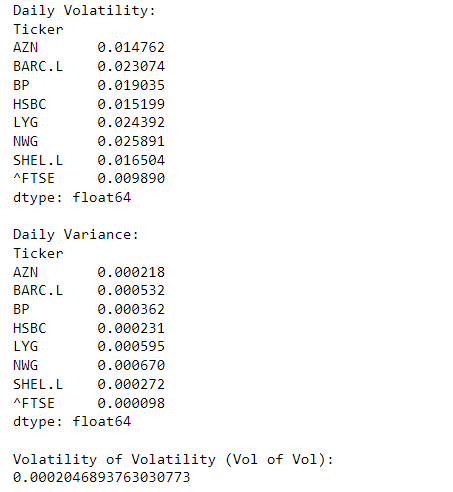
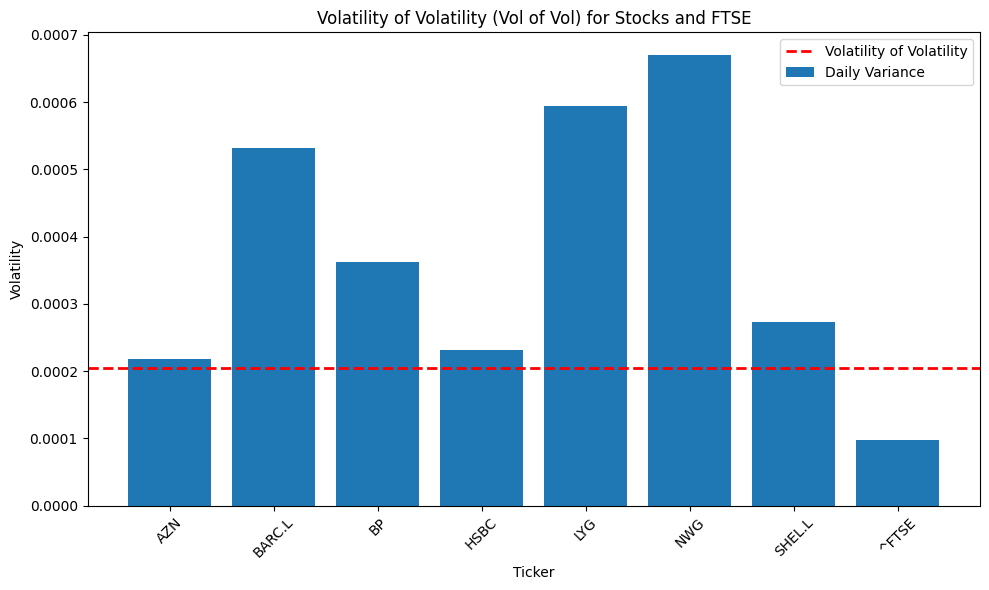
In the end, Vol of Vol has been extracted from the daily and annualised volatility parameters based on daily variance and daily standard deviation. The graph below extracted from daily stocks standard deviation does highlight how Vol of Vol carries a considerable risk of nearly 10%, which is not trivial, and as mentioned before Bank stocks seem to be the most at risk of higher volatility of stock prices and idiosyncratic volatility shocks.
In conclusion, this article emphasizes the critical importance of analyzing stock volatility and volatility of volatility (vol of vol) as primary tools for making informed investment decisions, while focusing on the statistical behaviours of stock price movements, investors can gain insights into the market’s inherent risks and potential opportunities for returns. The article underscores the importance of analyzing stock volatility and volatility of volatility (vol of vol) as the primary tools for making informed investment decisions, specifically utilising stock row data of AstraZeneca (AZN), Barclays (BARC), Lloyds (LLOY), NatWest Group (NWG), Royal Dutch Shell (SHEL), HSBC (HSBC), and BP (BP). By concentrating on the statistical behaviors of stock price movements, investors can extract critical insights into the market’s inherent risks and opportunities for returns, without the need for traditional balance sheet analysis. Choosing to completely disregard balance sheet analysis, this article makes a case for a more agile and market-responsive investment approach. It argues that traditional metrics of financial health and stability may not fully capture the nuances of market behaviour, which are often more immediate factors of stock performance. In a rapidly changing financial infrastructure, the ability to react to volatility trends can offer a competitive edge, making balance sheet consideration ridiculous and completely useless.
The volatility and vol of vol provide a dynamic, real-time perspective on market conditions, enabling investors to anticipate and respond to potential stock market risks effectively, as fluctuations in stock prices inherently contain the information and imprints that investors typically seek in balance sheet analysis, rendering such traditional methods redundant also for portfolio construction.
In high-frequency intraday stock price data, the primary focus is on the volatility of prices and volumes of transactions, as these data are essential for building responsive and agile investment strategies. By leveraging advanced quantitative models and real-time data, investors can stay ahead of market trends and optimize their portfolios. This approach emphasizes the agility and market responsiveness needed to navigate the intricacies of financial markets.