- The analysis focuses on a thorough time series analysis of major European stock market indices, including the DAX, Footsie, IBEX, Footsie MIB, CAC 40, Sweden OMX, Norway’s benchmark, Denmark’s benchmark, and the VIX.
Limitations of Technical Charts and Importance of Order Flow
- Technical charts are considered largely useless for professional trading as they do not capture critical real-time market data.
- Professional proprietary traders rely on volumes, order books, and order flows at different market levels to understand market dynamics.
- Markets are not perfectly efficient due to incomplete data (e.g., lack of dark pool information), meaning information is not equally distributed.
- Candlestick methods and indicators like RSI are insufficient; volume and order flow are crucial for understanding market direction and increasing trade probability.
Understanding Volume Profile (B, D, P)
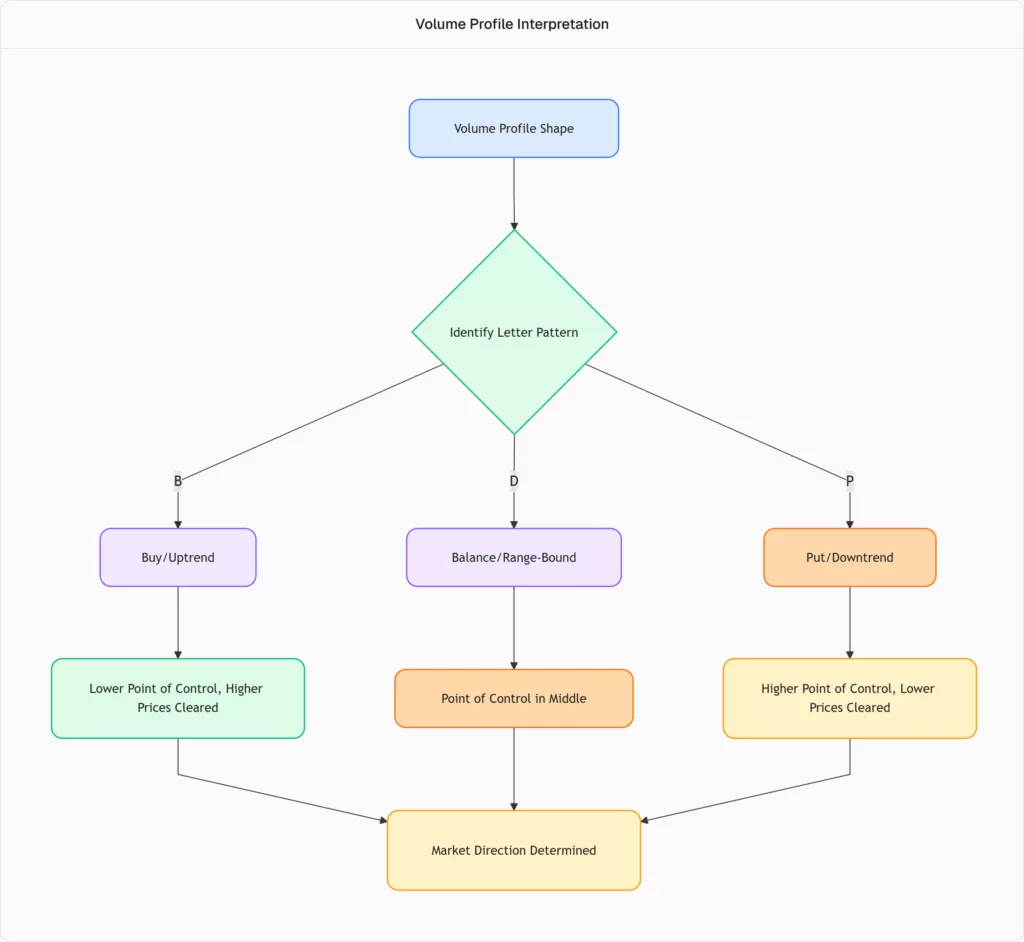
- The Volume Profile is a tool that uses historical data to identify trends based on specific letter shapes: B, D, and P.
- The longest black line in a volume profile indicates the price level with the largest volume of transactions during a specific period.
- The interpretation of these letters helps determine market trends:
- B (Buy): Indicates an uptrend where the point of control (highest volume) is at the lower end, and transactions clear at higher prices.
- D (Balance): Signifies a balanced trend within a certain range, with the point of control near the middle of the distribution.
- P (Put/Sell): Suggests a downtrend where the point of control is at the top of the distribution, indicating that the market will clear at lower prices.
- The DAX index has recently shown a “P” shape, suggesting a high probability of a market correction with prices clearing to the downside.
Here is a flowchart illustrating the interpretation of Volume Profile patterns:
Market Seasonality and Cyclicality
- The market exhibits clear seasonality:
- Q1 (January-March): Often volatile with corrections.
- April-August: Typically a period of upward trend with contained volatility and low risk.
- Late August/September/October: Prone to pullbacks, corrections, and portfolio rebalancing by institutional funds.
- Q4 (November-December): Often sees a “Santa Claus rally” or “Christmas rally,” providing short-term speculative opportunities after pullbacks.
- Low liquidity in August, particularly in Asian markets and sometimes Europe/US, can lead to increased volatility and liquidity issues.
- Specific months like October and March are often the most volatile for indices like the IBEX, Footsie 100, and Euro Stoxx 50, with outliers reaching 5% daily standard deviation.
Volatility Analysis and the VIX
- Volatility is a crucial measure; rising annualised volatility (e.g., from 15% to 20%) indicates increased price action and uncertainty.
- The VIX (Volatility Index) is a key indicator, and a build-up in its volatility almost certainly precedes a stock market event or correction.
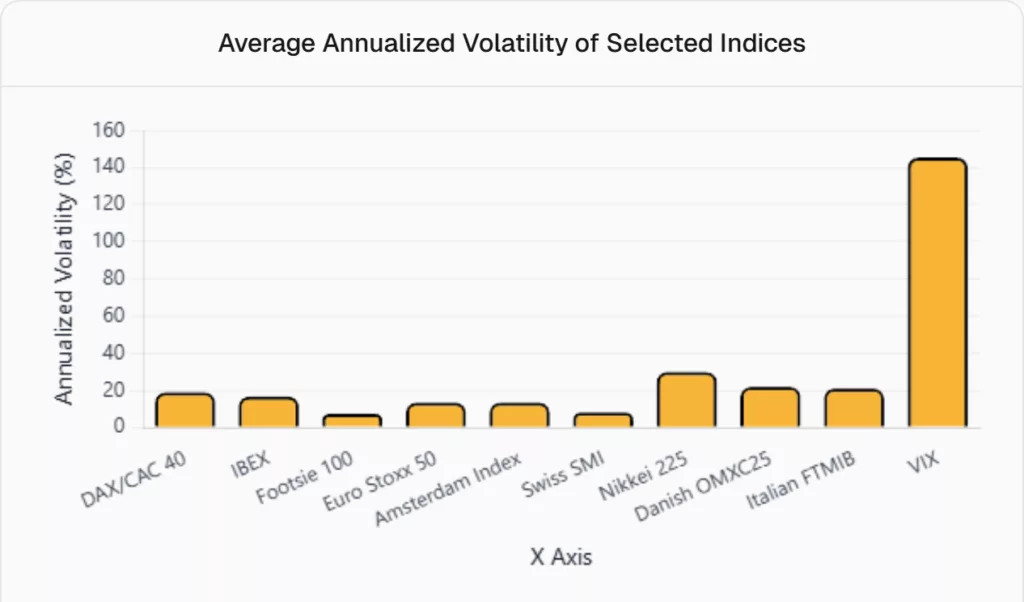
- European indices like the DAX, CAC 40, and Euro Stoxx 50 typically show annualised volatility between 16-22%, while the VIX can range from 113-178%.
- The Swiss market (SMI) is notably calmer, with annualised volatility of 6.2-10.2%, making it suitable for long-term passive investing.
- The Japanese Nikkei 225 is exceptionally volatile, with annualised volatility around 30% and daily moves of 2-3%.
- The Danish OMXC25 and Italian FTMIB also exhibit higher volatility, with Danish equities showing 24-20% annualised volatility.
Here is a bar chart comparing the average annualised volatility of selected stock market indices:
Risk Management Models (VaR, Expected Shortfall, EVT)
- Extreme Value Theory (EVT) and Peak Over Threshold theory are used to capture extreme volatility days and “black swan” scenarios.
- Value at Risk (VaR 95): Defines a 5% probability that a daily loss will exceed a certain percentage (e.g., 2% for DAX).
- Expected Shortfall (ES): Measures the average loss incurred when the VaR 95 threshold is breached, quantifying losses in excess of the VaR.
- For DAX, a VaR 95 of 2% implies a 5% chance of a daily loss of 2% or more, with an expected shortfall that can be as high as -36% in extreme cases.
- For CAC 40, a VaR 95 of 2.02% is common, with an expected shortfall of 3.2%.
- VIX has a very high VaR 95 of 10.5% and an expected shortfall of up to 36% in extreme cases.
- Ignoring fat tails (extreme events) in distribution is a critical mistake, as they are more frequent than acknowledged and define the stability and risk of financial assets.
- Tail risk analysis for European indices often shows a threshold around 2.7-2.8%, meaning breaching this level can indicate a distress scenario with larger drawdowns.
VIX Term Structure and Trading Signals
- The VIX term structure (the relationship between VIX futures contracts of different maturities) provides insights into future volatility expectations.
- Contango: An upward-sloping VIX curve where future prices are higher than spot prices, indicating that the market expects higher volatility in the coming months.
- Current conditions show a “calm contango,” where volatility is building up but is not yet stressed.
- This suggests potential for higher VIX prices, with the 6-month future potentially reaching 30.
- Backwardation: A downward-sloping VIX curve where short-term futures are more expensive than long-term futures, signalling immediate stress and very high short-term volatility.
- “Stress backwardation” is the most volatile VIX setup, leading to significant spikes in volatility (e.g., VIX at 45-52).
- The VIX term structure can provide trading signals, indicating opportunities to “long vol” (buy volatility) as a hedge against market downturns or for profit.
- Building long vol positions (e.g., buying VIX futures or call options) at the right moment can yield substantial gains during market corrections.
Bayesian Models for Inter-Index Correlation
- Advanced models, including Monte Carlo simulations and Bayesian methods, are used to estimate daily returns and volatility, and to analyse posterior distributions.
- These models interpolate daily data of one index (e.g., DAX) with other time series (CAC 40, IBEX, VIX, etc.) to understand correlations between their average daily returns and standard deviations.
- The models provide parameters such as the mean daily returns, high-density intervals (e.g., 95% or 3-97%), and Bayesian parameters like volatility persistence.
- For example, the Euro Stoxx 50 shows a positive regression coefficient with the DAX, indicating a strong positive correlation between their posterior distributions of average returns.
- These sophisticated models help anticipate market movements and prepare for potential market events by understanding underlying probabilistic distributions.