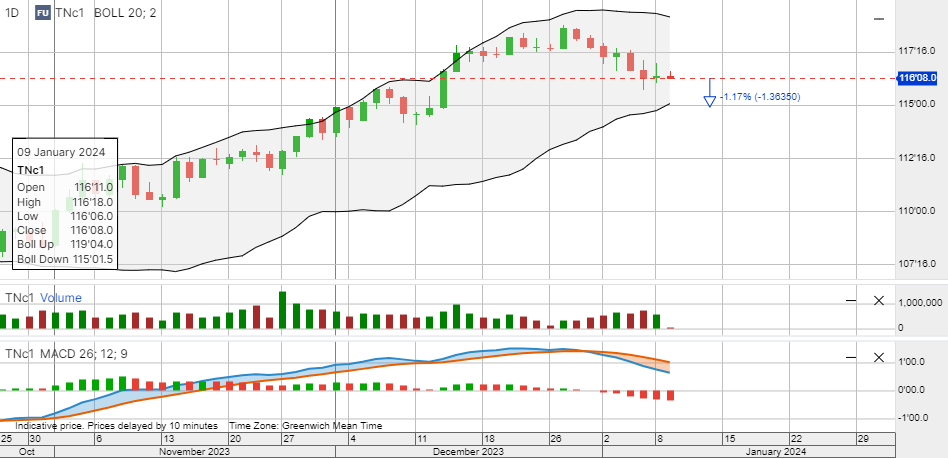
Treasuries futures chart Ultra 10-Year Treasuries chart signals a downtrend and drifts lower in the price of the Bond. There could be a consistent Sell-Off in Treasuries and a multiple standard deviation spike in yields.
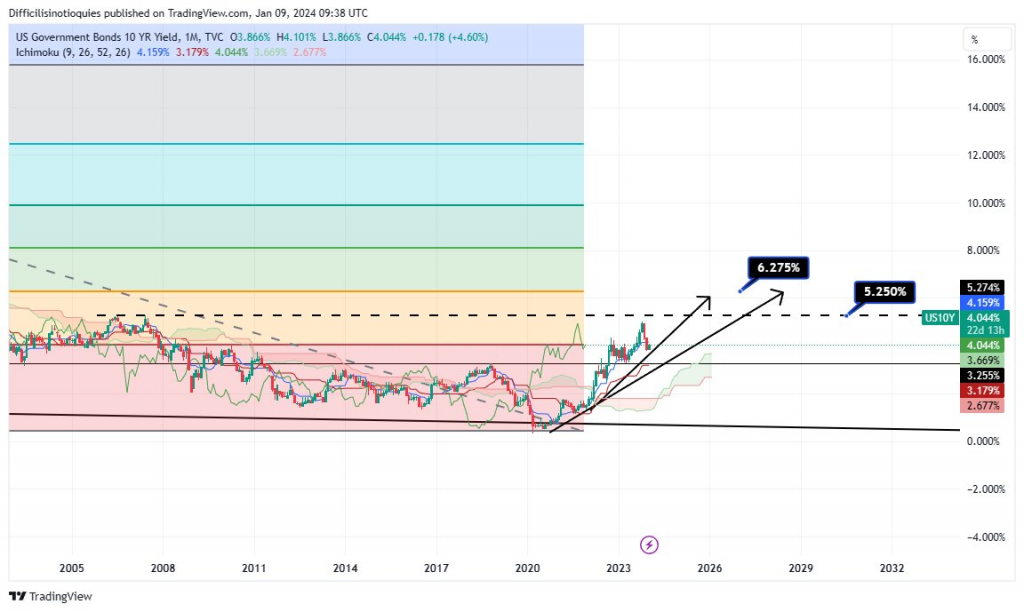
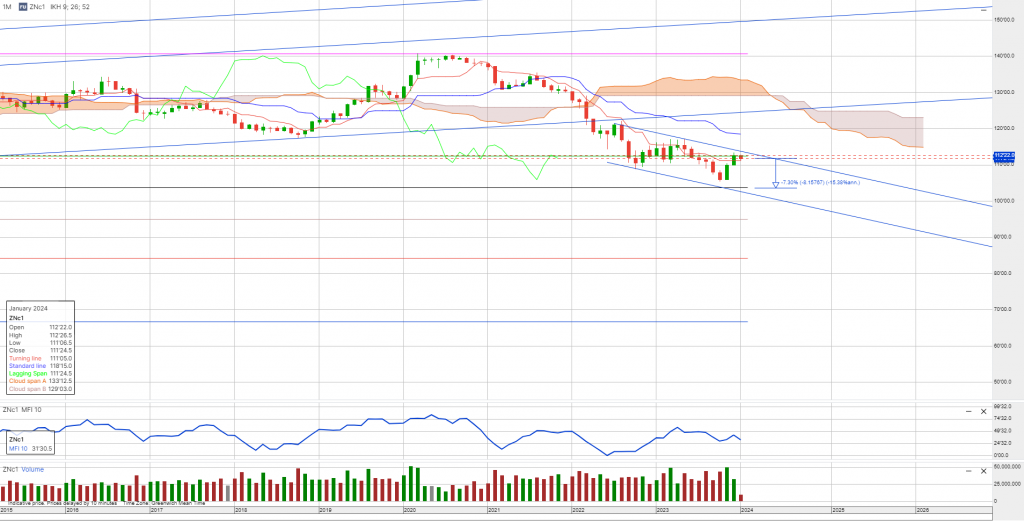
also the 10Year Treasury note chart, on a month timescale, has started a reversal sparked by Fib level 0.618 rejection $112’26, while a consistent selloff -7.30% in Treasuries could see the 0.50 Fib level $ 103’16 being priced and a 10Year Treasury well above 4.9% up to 6.25%
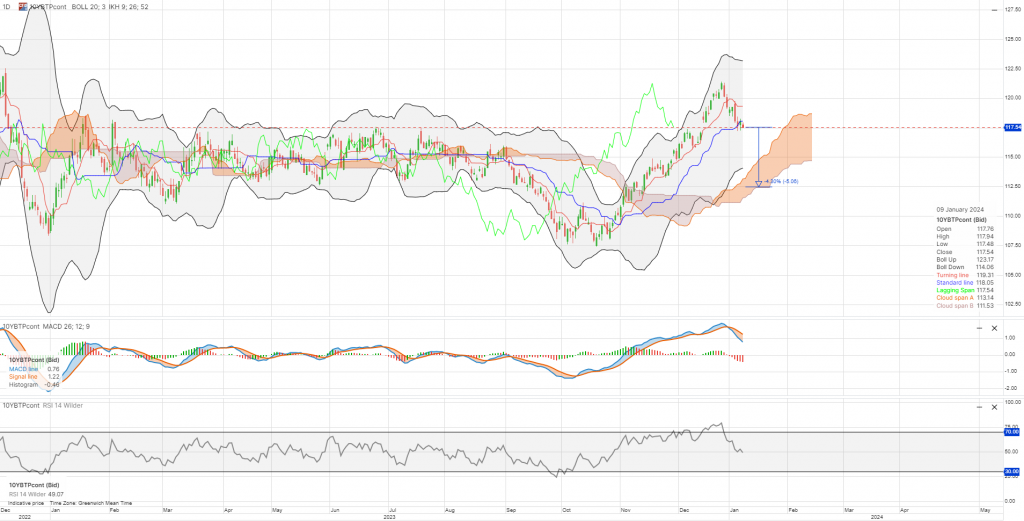
BTP 10Year chart,(daily timescale) already prompted a sell signal, with a Head & Shoulder pattern. Serious risk of a BTPs’ sell-off, repricing to €112.50. MACD oscillator has a lines crossover Sell signal.
Italy’s fiscal revenues are plagued by continuous tax evasion and tax fraud to the tune of €100 billion Euro every year. The Government fiscal revenue shortfall is about €-550 billion for the coming fiscal year and considering global liquidity factors, institutional investors and large bond funds could turn with brutal force on BTPs, with a much higher risk premium on yields.