Extracting Market Performance and Volatility Patterns of Blue-Chip Stocks and the FTSE100 Index
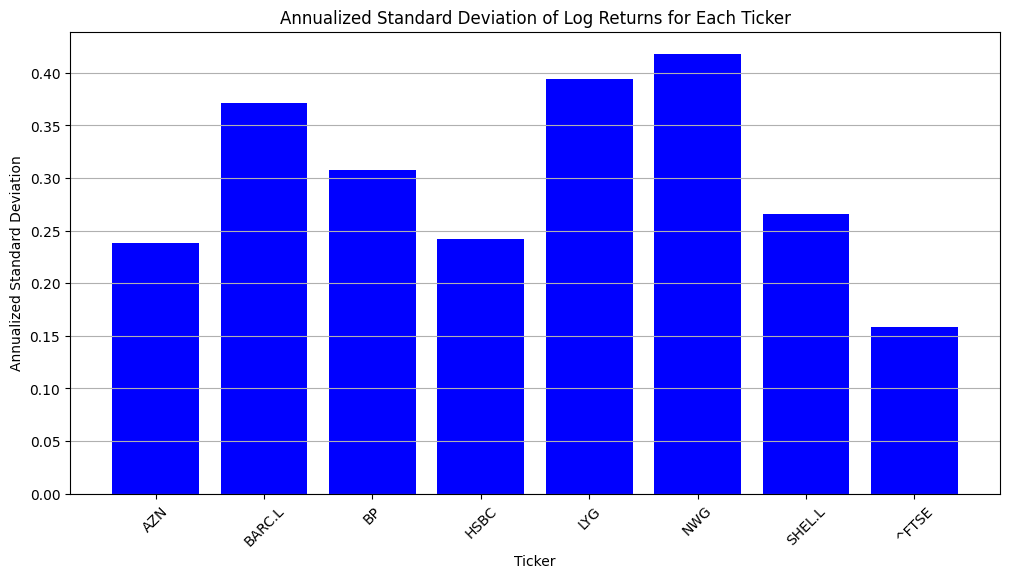
Samples of FTSE100 blue chip stocks and the FTSE100 index have been elaborated to understand the stocks’ returns and the index returns since 2010 up to date. A wide variety of descriptive statistics and volatility measures have been assembled, meanwhile,…
S&P 500 POTENTIAL -15% SELL-OFF
SPX price/volume, Daily timescale chart, below the 200-day Exponential Moving Average, that means SPX in logarithmic function. Most important SPX 3963 Point of Control SELL-OFF Signal, with a potential Head&Shoulder candlestick pattern. S&P500 price/volume trendline with a -15% | -17.5%…