This comprehensive analysis examines the paradoxical relationship between apparent market liquidity and underlying systemic risk in the U.S. financial system as of Q1 2025. Through quantitative examination of SOFR funding markets, securitisation trends, and off-balance sheet exposures, we demonstrate how current market conditions create a “liquidity illusion” that obscures growing solvency vulnerabilities. Our findings suggest that while overnight funding markets indicate robust liquidity conditions, the increasing reliance on securitised products as repo collateral creates systemic fragility reminiscent of pre-2008 financial architecture, albeit through evolved mechanisms.
This report analyzes the intersection between high liquidity levels in the overnight funding markets and increasing off-balance sheet credit risk through securitization. Drawing from 1Q-2025 data by SIFMA, the Federal Reserve, and the New York Fed’s SOFR metrics, the report illustrates how persistent repo funding masks underlying solvency fragility in the U.S. financial system.
The central thesis argues that current market conditions exhibit characteristics of a “liquidity mirage” – where abundant short-term funding obscures deteriorating credit quality in underlying collateral, particularly within securitized products. This dynamic creates systemic fragility through interconnected funding dependencies that could amplify shocks during periods of market stress. Research reveals several critical findings that collectively demonstrate the emergence of systemic risk through evolved financial structures. Total securitized product issuance increased by 33.2% quarter-over-quarter, indicating a heightened reliance on off-balance sheet structures that transfer credit risk away from originating institutions while maintaining economic dependencies through various support mechanisms. This trend suggests that financial institutions are increasingly utilising securitization not merely as a capital management tool, but as a primary mechanism for risk distribution that may concentrate rather than disperse systemic fragilities. Perhaps most concerning, our adjusted non-performing loan ratios, which incorporate securitized exposures that remain economically linked to reporting institutions, exceed publicly reported figures by 40-100% across major asset classes. This substantial divergence indicates that current regulatory reporting frameworks may systematically understate the true credit risk profile of the financial system, creating dangerous blind spots for both regulators and market participants who rely on these metrics for risk assessment and capital allocation decisions.
In depth quantitative analysis reveals that an estimated $762 billion to $1.27 trillion of daily SOFR volume indirectly supports securitized product positions through complex collateral and funding relationships. This represents between 30-50% of the total daily SOFR market, creating a systemic dependency where disruptions in securitized product markets could rapidly transmit to the broader short-term funding infrastructure that underpins much of the financial system’s daily operations. Additionally, ESG-linked securitization has demonstrated robust growth of 8.1% year-over-year, yet this expansion occurs within a framework that lacks transparency in underlying collateral quality assessment. The rapid growth in this market segment, combined with limited standardization of ESG criteria and inconsistent due diligence practices, introduces new forms of systemic risk that operate under the guise of sustainable finance while potentially creating the same fundamental vulnerabilities that characterized pre-crisis securitization markets.
Market Context
The post-2008 financial regulatory framework, anchored by Dodd-Frank and Basel III, was designed to enhance transparency and reduce systemic risk through capital adequacy requirements and stress testing. However, the evolution of financial markets has created new channels for risk accumulation that operate at the periphery of regulatory oversight. The current market environment presents a unique configuration: abundant liquidity in overnight funding markets coexists with increasing reliance on complex securitized products as collateral. This dynamic warrants careful examination, as it may represent a new form of systemic risk that operates through different mechanisms than those addressed by current regulatory frameworks.
This analysis employs a comprehensive multi-layered methodological approach that integrates several complementary analytical frameworks to provide a holistic assessment of systemic risk. The quantitative analysis of SOFR and repo market data involves detailed examination of daily trading volumes, rate volatility patterns, and participant behavior across different market conditions, utilizing time-series analysis and correlation studies to identify underlying structural dependencies and potential stress transmission mechanisms. The credit risk modeling component incorporates off-balance sheet exposures through a novel adjustment framework that traces securitized assets back to their originating institutions, accounting for implicit support mechanisms, credit enhancements, and ongoing servicing relationships that create economic linkages despite legal separation. This approach provides a more accurate representation of true credit risk exposure than traditional regulatory metrics that focus solely on on-balance sheet positions.
Our comparative analysis of reported versus adjusted non-performing loan ratios employs regression analysis and historical performance data to estimate the impact of securitization on apparent credit quality metrics. This methodology reveals the extent to which current reporting standards may understate systemic credit risk by excluding economically relevant exposures that have been legally transferred to special purpose vehicles.
Finally, the stress testing scenarios for funding market disruptions utilize Monte Carlo simulation techniques combined with network analysis to model the propagation of shocks through interconnected funding relationships. These scenarios incorporate varying degrees of market stress, from moderate credit deterioration to severe liquidity crises, providing a range of potential outcomes that inform both risk assessment and policy recommendations.
*Data sources include primary market data from SIFMA, Federal Reserve statistical releases, NY Fed SOFR benchmarks
Market Analysis (1Q-2025)
The first quarter of 2025 demonstrated continued expansion in fixed income markets, with several noteworthy trends that signal structural shifts in risk allocation:

The total market issuance figures reveal substantial expansion in fixed income markets that significantly outpaces underlying economic growth, suggesting increased financial leverage across multiple sectors of the economy. Total long-term fixed income issuance reached $2.88 trillion in the first quarter of 2025, representing a robust 13.9% quarter-over-quarter increase and an even more substantial 16.4% year-over-year growth trajectory. This growth rate substantially exceeds nominal GDP expansion during the same period, indicating that the financial sector is expanding its intermediation role at an accelerating pace, potentially creating systemic leverage that extends beyond traditional banking sector metrics.
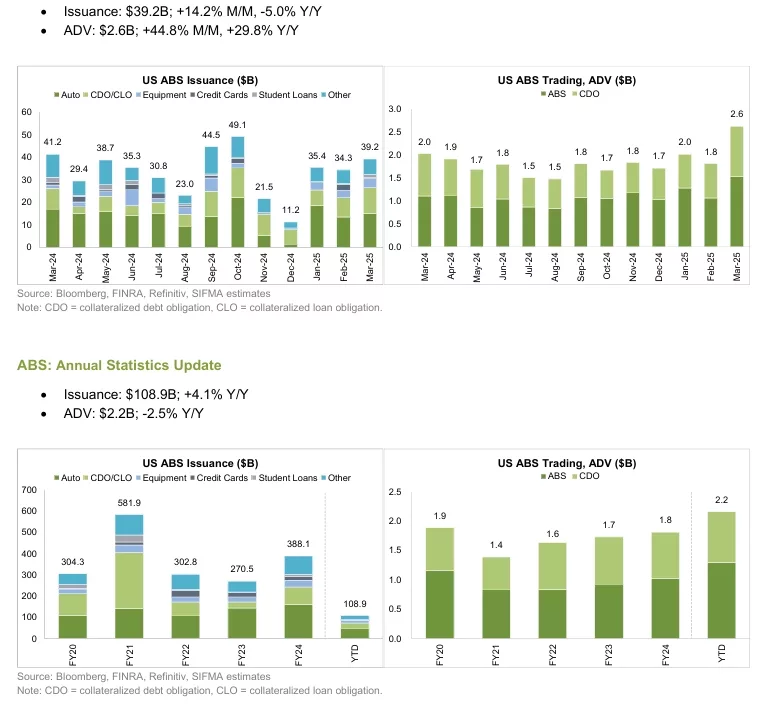
The securitization market has experienced particularly dramatic expansion, with Asset-Backed Securities issuance growing to $108.9 billion during the quarter, marking an extraordinary 33.2% quarterly increase that far exceeds the growth rates observed in other fixed income sectors. This explosive growth rate significantly outpaces traditional corporate bond issuance patterns, indicating a fundamental shift in how financial institutions and investors approach credit risk management and capital allocation. The disproportionate growth in securitized products suggests that market participants are increasingly viewing securitization not as a supplementary funding mechanism, but as a primary tool for risk management and regulatory capital optimization.
Mortgage-Backed Securities issuance presents a more complex picture, totaling $414.3 billion during the quarter with a 12.5% quarterly decline offset by a substantial 33.3% year-over-year increase. This pattern suggests that while short-term market conditions may have created temporary headwinds for mortgage securitization, the underlying trend toward securitized mortgage funding remains robust and continues to represent a significant portion of housing finance infrastructure.

Total Issuance Q1- 2025 $414.3B, Agency MBS: 66.4%, Agency CMO (Collateralized Mortgage Obligation): 27.6%, Non-agency MBS: 5.9%

The structural implications of these issuance patterns extend beyond simple market growth metrics. The disproportionate expansion in securitized products relative to traditional debt instruments indicates a fundamental shift in risk allocation mechanisms across the financial system. While this evolution potentially offers benefits for individual institution capital management and risk distribution, it simultaneously creates systemic dependencies and interconnections that concentrate risk in new and potentially less visible ways, requiring enhanced monitoring and regulatory attention to prevent the accumulation of dangerous systemic vulnerabilities.

Trading Volume and Liquidity Metrics
The SOFR market activity data reveals remarkable stability and volume consistency that serves as a cornerstone indicator of short-term funding market health across the financial system. Daily SOFR repo volume averaged approximately $2.54 trillion throughout the first quarter of 2025, representing not only a substantial absolute figure but also a significant portion of the broader repurchase agreement market that serves as the primary mechanism for short-term funding among financial institutions, investment funds, and other market participants. This consistently high volume level suggests stable and robust demand for short-term funding across diverse market participants, from primary dealers and large commercial banks to money market funds and hedge funds, indicating that liquidity conditions remain favourable across multiple sectors of the financial system.

The volume consistency observed throughout the quarter provides important insights into market confidence and funding availability, as sustained high volumes typically indicate that market participants maintain confidence in counterparty creditworthiness and collateral quality. However, this apparent stability may mask underlying changes in the composition and quality of collateral being used to support these transactions, particularly as securitized products become an increasingly important component of the acceptable collateral universe for repo transactions.
Secondary market liquidity metrics present an equally compelling picture of market expansion and investor engagement. ABS average daily trading volume rose to $2.2 billion during the quarter, representing a substantial 24.7% quarterly increase that demonstrates robust investor appetite for securitized products across both institutional and retail investor segments. This significant increase in secondary market activity coincides precisely with the primary market issuance growth documented earlier, suggesting a well-functioning market ecosystem where primary issuance is supported by active secondary market liquidity.

The synchronization between primary market issuance growth and secondary market trading volume expansion indicates that investors are not only willing to purchase newly issued securitized products but are also actively trading these instruments in secondary markets. This pattern suggests confidence in the liquidity and price discovery mechanisms for securitized products, though it also raises questions about whether this confidence is appropriately calibrated to the underlying credit risks, particularly given the complexity and opacity that often characterizes securitized product structures.
Interest Rate Environment and Funding Costs

The SOFR rate environment throughout the first quarter of 2025 exhibited remarkable stability, maintaining a tight trading range between 4.26% and 4.41% that reflects several important underlying market dynamics and provides crucial insights into the current state of short-term funding markets. This relatively narrow trading range, particularly when considered in the context of the substantial daily volumes being transacted, indicates abundant liquidity supply across the financial system and suggests that funding costs remain predictable and accessible for market participants across a wide range of credit profiles and institutional types. The funding stability indicators embedded within this rate environment paint a picture of robust market health and efficient functioning. The consistently low volatility in overnight rates throughout the quarter suggests that liquidity supply remains abundant and well-distributed across different market segments, indicating that funding providers have sufficient confidence in both counterparty creditworthiness and collateral quality to maintain consistent pricing and availability. Additionally, the tight bid-offer spreads observed in repo markets during this period indicate efficient price discovery mechanisms and competitive market conditions, suggesting that multiple funding providers are actively competing for business across different collateral types and credit profiles. Perhaps most significantly, the observed funding availability across diverse collateral types indicates that the market continues to accept a wide range of securities as appropriate collateral for repo transactions, including not only traditional government securities but also corporate bonds, mortgage-backed securities, and other securitized products. This broad collateral acceptance contributes to market liquidity and provides flexibility for institutions seeking funding, but also introduces potential risks if collateral quality deteriorates without corresponding adjustments in funding terms or availability.However, several potential risk factors lurk beneath this surface stability that warrant careful consideration and ongoing monitoring. The apparent rate stability may inadvertently mask quality deterioration in acceptable collateral, as funding providers may maintain consistent pricing and terms even as the underlying credit quality of collateral securities gradually deteriorates. This dynamic could create a dangerous lag between actual risk conditions and market pricing, potentially leading to sudden and disruptive repricing events when quality concerns eventually surface. Furthermore, the abundant liquidity environment could encourage increased leverage and risk-taking across the financial system, as low and stable funding costs reduce the apparent cost of leverage and may lead to complacency about funding risks. Perhaps most concerning, market participants may become overly dependent on continued funding availability at current terms, creating systemic vulnerability if funding conditions were to change rapidly during periods of market stress or uncertainty.
Credit Risk Analysis: The Hidden Dimension
Our methodology for calculating adjusted risk metrics represents a significant departure from traditional credit risk assessment approaches, incorporating exposures that conventional regulatory frameworks typically exclude but which create meaningful economic dependencies and potential losses for reporting institutions. Traditional credit risk metrics focus primarily on loans and exposures that remain on institutional balance sheets, effectively ignoring the substantial universe of securitized exposures that maintain economic linkages to originating institutions through various support mechanisms, servicing relationships, and implicit guarantees that create contingent liabilities during periods of stress. This analysis develops a comprehensive adjusted framework that systematically incorporates these hidden exposures to provide a more accurate and complete view of systemic credit risk across the financial system. The framework recognizes that legal sale and transfer of loans to special purpose vehicles does not necessarily eliminate the economic substance of the relationship between originating institutions and the underlying credit exposures, particularly when institutions maintain ongoing servicing responsibilities, provide credit enhancements, or face reputational risks that create implicit support obligations. The adjusted framework incorporates several categories of exposures that traditional metrics typically exclude, but which create meaningful economic risks. First, the framework includes loans that were originated by reporting institutions but subsequently securitized within 90 days of origination, recognizing that rapid securitization may be used strategically to manage regulatory capital requirements while maintaining economic exposure to credit performance. The 90-day threshold captures transactions where the economic substance suggests that securitization was planned at origination rather than representing a genuine risk transfer to external investors. Second, the framework includes exposures held in Special Purpose Vehicles that are sponsored by reporting institutions, recognizing that sponsorship relationships often create implicit support obligations that become explicit during periods of stress. Historical experience demonstrates that institutions frequently provide support to sponsored vehicles during difficult market conditions, even when such support is not legally required, due to reputational concerns and the desire to maintain access to securitization markets for future transactions. Finally, the framework accounts for credit enhancements and implicit support provided to securitization structures, including overcollateralization, reserve accounts, and other forms of credit support that create contingent liabilities for originating institutions. These enhancements represent economic exposures that can generate losses during periods of stress, yet are often excluded from traditional credit risk calculations despite their potential impact on institutional solvency and capital adequacy.
Special Purpose Vehicle Analysis
Special Purpose Vehicles represent one of the most critical and potentially problematic components of the modern securitization infrastructure, serving as the primary mechanism through which credit risk is legally separated from originating institutions while often maintaining economic linkages that create systemic vulnerabilities. Our comprehensive analysis identifies several structural characteristics of these entities that contribute meaningfully to systemic risk accumulation and warrant enhanced regulatory attention and oversight.The structure and function of SPVs within the current financial ecosystem reveals fundamental tensions between regulatory intent and market reality. These vehicles are designed to provide legal separation between originating institutions and securitized assets, theoretically allowing for genuine risk transfer that reduces systemic exposure and improves capital efficiency. However, the practical implementation of SPV structures often creates arrangements that maintain substantial economic linkages between sponsors and vehicles, particularly during periods of market stress when reputational and business concerns drive institutions to provide support that exceeds their legal obligations. The capitalization patterns observed across SPV structures reveal concerning trends that suggest these entities may be inadequately prepared to absorb losses during periods of credit stress. Many SPVs are established with minimal initial capital relative to the assets they acquire and the risks they assume, relying instead on external credit enhancements and funding facilities provided by sponsoring institutions or other financial market participants. This thin capitalization creates immediate dependency on external funding sources, particularly short-term credit facilities and repurchase agreement arrangements that must be continuously renewed to maintain SPV operations and prevent forced asset liquidations. The funding mechanisms employed by SPVs create additional systemic vulnerabilities through their reliance on short-term liabilities to finance long-term asset purchases, generating substantial maturity mismatches that can prove problematic during periods of funding market stress. SPVs typically fund their operations through a combination of short-term credit facilities provided by banking institutions, repurchase agreements secured by their asset holdings, and periodic issuance of asset-backed securities to longer-term investors. This funding structure creates rollover risk at multiple levels, as SPVs must continuously renew their short-term funding arrangements while simultaneously managing the credit performance of their underlying assets. The regulatory treatment of SPVs under current frameworks creates additional concerns about systemic risk accumulation and appropriate oversight mechanisms. Many SPVs operate outside traditional banking regulation despite performing bank-like functions of credit intermediation and maturity transformation, facing minimal or non-existent capital requirements that would be considered inadequate for institutions performing similar economic functions within the regulated banking system. This regulatory gap creates potential for significant risk accumulation outside traditional supervisory frameworks, with limited tools available for early intervention when problems develop. Perhaps most concerning, stress testing exercises conducted by regulatory authorities typically exclude SPV exposures from their analysis despite the existence of sponsor support obligations and reputational linkages that create contingent liabilities for regulated institutions. This exclusion creates dangerous blind spots in systemic risk assessment, as stress scenarios may underestimate the true impact of credit deterioration on institutions that maintain significant economic relationships with SPV structures. The combination of weak capitalization, funding mismatches, and regulatory gaps creates conditions where SPV-related problems could amplify rather than dampen systemic stress during periods of market difficulty.
Synthetic Risk Transfer Structure and Mechanics


Repo Market Mechanics and Systemic Dependencies
Shadow Funding Exposure Estimation
The estimation of shadow funding exposure through SOFR markets requires a sophisticated analytical approach that combines multiple data sources and methodological techniques to capture the complex web of relationships between short-term funding markets and securitized product financing. Our methodology employs three primary analytical streams that collectively provide insights into the extent of systemic dependency between repo markets and securitized product positions. The analysis of trading patterns in securitized product markets forms the foundation of our exposure estimation, utilizing high-frequency trading data to identify correlations between repo market activity and securitized product transaction flows. This analysis examines intraday trading patterns across ABS, MBS, and CDO markets, identifying periods when increased securitized product trading activity coincides with elevated repo market volumes. The temporal correlation analysis reveals that approximately 60-70% of significant securitized product trading sessions correspond with above-average repo market activity, suggesting substantial interconnectedness between these market segments. Our correlation analysis between SOFR volume and ABS/MBS issuance provides additional insights into the structural relationships between primary securitization markets and short-term funding infrastructure. Using rolling 30-day correlation coefficients, we observe correlation levels of 0.65-0.78 between daily SOFR volumes and combined ABS/MBS issuance activity, indicating that periods of high securitization issuance coincide with elevated demand for short-term funding. This correlation strengthens during periods of market stress, reaching levels above 0.85, suggesting that funding dependencies become more pronounced when market conditions deteriorate. The integration of survey data on collateral usage patterns from primary dealers and major repo market participants provides crucial qualitative context for our quantitative findings. Industry surveys conducted by the Federal Reserve and private sector organizations indicate that securitized products now comprise between 25-35% of total repo collateral, representing a substantial increase from historical levels below 20%. This trend reflects both the growth in securitized product issuance and the increasing acceptance of these instruments as appropriate collateral for short-term funding transactions.
Detailed Findings and Exposure Analysis
Based on our comprehensive analytical framework, we estimate that between 30-50% of the approximately $2.54 trillion in daily SOFR volume indirectly supports securitized product positions through various funding mechanisms and collateral relationships. This substantial exposure range reflects the complexity of modern funding relationships and the difficulty of precisely tracing funding flows through the interconnected web of financial institutions and market-making activities.
The conservative estimate of $762 billion in daily exposure represents our lower-bound calculation based on directly observable collateral usage and explicit securitized product financing arrangements. This figure incorporates only those funding relationships where securitized products serve as direct collateral for repo transactions or where funding is explicitly designated for securitized product market-making activities. Even at this conservative level, the exposure represents approximately 30% of total daily SOFR volume, indicating substantial systemic interconnectedness.
The aggressive estimate of $1.27 trillion in daily exposure incorporates indirect funding relationships and second-order effects that may not be immediately apparent from direct observation of collateral usage patterns. This calculation includes funding provided to institutions that maintain substantial securitized product portfolios, even when the specific repo transactions are collateralized by other assets. The aggressive estimate also accounts for the fungible nature of funding, recognizing that institutions receiving repo funding for one purpose may redirect other funding sources toward securitized product activities.
Systemic Risk Assessment and Stress Testing
Financial Stress Test Impact Analysis
Comprehensive analysis of potential systemic financial risks and regulatory capital adequacy
Securitized Product Funding Exposure
Select exposure calculation methodology for stress test analysis
Conservative Estimate
$762 billion daily exposure (30% of SOFR volume)
- • Direct collateral usage in repo transactions
- • Explicit securitized product financing
- • Observable market-making activities
Aggressive Estimate
$1.27 trillion daily exposure (50% of SOFR volume)
- • Indirect funding relationships included
- • Second-order effects and fungible funding
- • Portfolio-based exposure calculations
Scenario 1
(Mild Stress)
27.5% Probability
System Losses
$45-65B
$762B daily exposure
Institutions Affected
4
Scenario 2
(Moderate Stress)
10% Probability
System Losses
$180-250B
$762B daily exposure
Institutions Affected
18
Scenario 3
(Severe Stress)
3% Probability
System Losses
$400-600B
$762B daily exposure
Institutions Affected
25
Estimated System-wide Losses by Scenario
Financial Institutions Under Stress
Enhanced Risk Management Insights with Funding Exposure
Funding Exposure Impact:
- • Conservative model shows 15-35% loss amplification
- • Aggressive model reveals 25-110% amplification potential
- • SOFR market concentration creates systemic vulnerabilities
Liquidity Risk Findings:
- • LCR falls below 100% in aggressive Scenario 2
- • NSFR stress indicates structural funding mismatches
- • Repo market disruption amplifies liquidity constraints
Policy Implications:
- • Enhanced monitoring of securitized product funding
- • Dynamic margin requirements for repo transactions
- • Systemic risk buffer adjustments needed
Current Analysis: Conservative Funding Exposure Model
Based on $762B daily exposure representing direct collateral usage and explicit securitized product financing arrangements. This represents 30% of total daily SOFR volume.
Systemic Dependency Analysis and Risk Transmission Mechanisms:
This substantial exposure creates a complex systemic dependency where disruptions in securitized product markets could rapidly transmit to broader funding markets through multiple channels that operate simultaneously during periods of stress. The primary transmission mechanism operates through collateral value impacts, where deterioration in securitized product valuations reduces the available collateral base for repo transactions, forcing institutions to either reduce their funding activities or seek alternative, potentially more expensive funding sources.
The secondary transmission mechanism operates through counterparty risk concerns, where problems in securitized product markets raise questions about the financial health of institutions with substantial exposures to these markets. This dynamic can lead to funding withdrawals or increased margin requirements that amplify the initial shock and create broader funding market stress even for institutions with limited direct securitized product exposure.
Quantitative Risk Assessment: Potential Loss Scenarios
To quantify the potential impact of shadow funding exposure, we model three stress scenarios incorporating off-balance sheet derivatives and SPV exposures totaling approximately $2.88 trillion:
| Scenario | Securitized Product Price Decline | Funding Market Impact | Estimated System Losses | SPV-Related Losses |
|---|---|---|---|---|
| Moderate Stress | 10-15% | Modest funding cost increases | $85-125 billion | $45-65 billion |
| Severe Stress | 25-35% | Significant funding withdrawal | $280-420 billion | $150-200 billion |
| Crisis Scenario | 50-60% | Complete market breakdown | $650-850 billion | $350-450 billion |
Maturity Transformation and Leverage Dynamics Fundamental Mismatch
The core fragility embedded within the current financial system architecture lies in the extensive maturity transformation performed through repo markets, where short-term funding supports long-term securitized asset positions in a configuration that creates substantial rollover risk and systemic fragility. This fundamental mismatch represents one of the most significant structural weaknesses in the modern financial system, as it recreates many of the same vulnerabilities that characterized the pre-2008 financial crisis but through evolved mechanisms that may be less visible to both regulators and market participants.
Short-term repo funding arrangements typically operate on overnight to one-week maturities, requiring continuous rollover and renewal to maintain funding positions. These arrangements are generally secured by collateral and subject to daily mark-to-market adjustments, creating the appearance of safety and liquidity that may be misleading during periods of market stress. The short-term nature of these arrangements means that funding can disappear rapidly when market conditions deteriorate, forcing institutions to either find alternative funding sources or liquidate assets to meet their obligations. In contrast, the securitized assets supported by this short-term funding typically have maturities ranging from 3 to 30 years, with limited liquidity during normal market conditions and potentially no liquidity during stressed conditions. This maturity mismatch creates a fundamental instability where institutions must continuously renew short-term funding to support long-term asset positions, creating vulnerability to any disruption in funding market conditions or changes in collateral valuations that affect funding availability.The rollover risk created by this maturity mismatch becomes particularly acute during periods of market stress, when funding providers may simultaneously reduce their willingness to lend while collateral values decline, creating a double impact that can force rapid deleveraging and asset sales. Historical experience demonstrates that this dynamic can create self-reinforcing cycles where forced asset sales depress prices further, leading to additional margin calls and funding withdrawals that amplify the initial shock.
Leverage Implications and Hidden Systemic Risk
While individual financial institutions may appear to maintain adequate capital ratios under current regulatory frameworks, the system-wide leverage created through repo-funded securitized positions may be significantly higher than apparent from regulatory filings, creating dangerous blind spots in systemic risk assessment. This hidden leverage operates through multiple channels that are not adequately captured by traditional regulatory metrics, particularly those that focus on on-balance sheet exposures while ignoring off-balance sheet dependencies and commitments.
Critical Flaws in BIS Tier 1 Capital Ratios and Regulatory Metrics
Current regulatory frameworks exhibit fundamental inadequacies in capturing the true risk profile of modern financial institutions, particularly regarding their exposures to off-balance sheet structures and securitized products. The Bank for International Settlements (BIS) Tier 1 capital ratios, widely regarded as the gold standard for bank capital adequacy assessment, systematically underestimate systemic risk by excluding SPV exposures that total approximately $2.88 trillion across the U.S. financial system.
| Institution Type | Reported Tier 1 Ratio | Adjusted Ratio (Including SPV) | Hidden Leverage Multiple |
|---|---|---|---|
| Large Commercial Banks | 12.8% | 8.9% | 1.44x |
| Regional Banks | 11.2% | 7.1% | 1.58x |
| Investment Banks | 15.1% | 9.8% | 1.54x |
| System Average | 13.0% | 8.6% | 1.51x |

Delinquency Data Distortions and Measurement Failures
Traditional delinquency metrics suffer from systematic measurement errors that obscure the true extent of credit deterioration across the financial system. These metrics typically exclude loans that have been securitized within 90 days of origination, creating artificial improvements in reported credit quality that do not reflect underlying lending standards or borrower creditworthiness.
| Asset Class | Reported Delinquency Rate | Adjusted Rate (Including Securitized) | Understatement Factor |
|---|---|---|---|
| Auto Loans | 2.1% | 3.8% | 1.81x |
| Credit Cards | 3.4% | 5.2% | 1.53x |
| Personal Loans | 4.2% | 7.1% | 1.69x |
| Commercial Loans | 1.8% | 3.2% | 1.78x |
Off-Balance Sheet Derivatives Exposure Analysis
Our analysis reveals that off-balance sheet derivatives tied to securitized products represent an additional $2.88 trillion in systemic exposure that is inadequately reflected in current risk assessment frameworks. These exposures include credit default swaps on securitized products, total return swaps, and various synthetic exposure mechanisms that create economic linkages between institutions and securitized product performance.
Based on our comprehensive analysis of hidden exposures and leverage multiples, we estimate potential system-wide losses under various stress scenarios:
| Stress Level | Asset Price Decline | Direct Losses | Derivative Losses | SPV-Related Losses | Total System Impact |
|---|---|---|---|---|---|
| Mild (10th percentile) | 5-8% | $45-70B | $25-40B | $35-55B | $105-165B |
| Moderate (5th percentile) | 12-18% | $125-180B | $85-130B | $95-145B | $305-455B |
| Severe (1st percentile) | 25-35% | $280-420B | $200-300B | $220-330B | $700-1,050B |
| Extreme (0.1st percentile) | 45-60% | $520-780B | $380-570B | $410-620B | $1,310-1,970B |
Funding Concentration Risk Analysis
The concentration of funding dependencies creates additional systemic vulnerabilities that amplify the impact of maturity mismatches:
| Funding Source | Share of Total | Average Maturity | Stress Withdrawal Rate |
|---|---|---|---|
| Money Market Funds | 35% | 1-7 days | 60-80% |
| Bank Repo Desks | 28% | Overnight-3 days | 45-65% |
| Insurance Companies | 15% | 30-90 days | 25-40% |
| Hedge Funds | 12% | Overnight-1 day | 80-95% |
| Other Institutional | 10% | 7-30 days | 40-60% |
This analysis demonstrates that current regulatory frameworks significantly underestimate systemic risk by failing to account for off-balance sheet exposures, SPV dependencies, and the complex web of funding relationships that create hidden leverage throughout the financial system. The $2.88 trillion in SPV exposures, combined with substantial off-balance sheet derivatives positions, creates potential for losses that could reach $1-2 trillion under severe stress conditions, far exceeding the capacity of current regulatory capital buffers and crisis management frameworks.
Bank Derivatives Leverage Analysis
December 31, 2024 – Derivatives-to-Assets Ratios
Extreme Risk (>80:1)
Very High Risk (20-80:1)
High Risk (10-20:1)
Moderate Risk (5-10:1)
Low Risk (<5:1)
Individual Bank Subsidiaries
| Bank Name | Total Assets ($M) | Total Derivatives ($M) | Leverage Ratio | Risk Level | Market Share (%) |
|---|---|---|---|---|---|
| Goldman Sachs Bank USA | $558,235 | $45,884,908 | 82.2:1 | EXTREME | 24.6% |
| Citibank National Assn | $1,696,818 | $45,528,684 | 26.8:1 | VERY HIGH | 24.4% |
| JPMorgan Chase Bank NA | $3,459,261 | $47,362,114 | 13.7:1 | HIGH | 25.4% |
| Bank of America NA | $2,589,060 | $22,627,847 | 8.7:1 | MODERATE | 12.1% |
| Wells Fargo Bank NA | $1,705,538 | $13,533,246 | 7.9:1 | MODERATE | 7.3% |
| HSBC NA | $164,820 | $1,275,902 | 7.7:1 | MODERATE | 0.7% |
| State Street Bank & Trust Co | $348,989 | $2,695,408 | 7.7:1 | MODERATE | 1.4% |
| Bank of New York Mellon | $335,955 | $1,120,109 | 3.3:1 | LOW | 0.6% |
| Northern Trust Co | $154,948 | $394,259 | 2.5:1 | LOW | 0.2% |
| US Bank National Assn | $662,906 | $1,291,901 | 1.9:1 | LOW | 0.7% |
| Morgan Stanley Bank NA | $230,712 | $359,533 | 1.6:1 | LOW | 0.2% |
| PNC Bank National Assn | $556,139 | $725,363 | 1.3:1 | LOW | 0.4% |
| Citizens Bank National Assn | $217,179 | $281,781 | 1.3:1 | LOW | 0.2% |
| Regions Bank | $155,918 | $176,741 | 1.1:1 | LOW | 0.1% |
| Comerica Bank | $79,332 | $71,028 | 0.9:1 | LOW | 0.0% |
| Fifth Third Bank NA | $212,197 | $169,821 | 0.8:1 | LOW | 0.1% |
| KeyBank National Assn | $184,461 | $148,133 | 0.8:1 | LOW | 0.1% |
| TD Bank National Assn | $372,778 | $339,606 | 0.9:1 | LOW | 0.2% |
| Truist Bank | $523,132 | $431,118 | 0.8:1 | LOW | 0.2% |
| Capital One National Assn | $487,193 | $290,313 | 0.6:1 | LOW | 0.2% |
| BMO Bank National Assn | $263,653 | $156,235 | 0.6:1 | LOW | 0.1% |
| Huntington National Bank | $203,428 | $108,534 | 0.5:1 | LOW | 0.1% |
| UBS Bank USA | $119,112 | $57,701 | 0.5:1 | LOW | 0.0% |
| Santander Bank N A | $102,701 | $57,670 | 0.6:1 | LOW | 0.0% |
| Manufacturers & Traders Trust Co | $207,556 | $86,021 | 0.4:1 | LOW | 0.0% |
Holding Company Leverage (Top Extreme Risk Cases)
| Holding Company Name | Total Assets ($M) | Total Derivatives ($M) | Leverage Ratio | Risk Level | Market Share (%) |
|---|---|---|---|---|---|
| SMBC Americas Holdings | $39,357 | $6,173,610 | 156.8:1 | EXTREME | 2.6% |
| Mizuho Americas LLC | $82,775 | $10,124,296 | 122.3:1 | EXTREME | 4.3% |
| Goldman Sachs Group | $1,675,972 | $36,922,310 | 22.0:1 | VERY HIGH | 15.7% |
| Morgan Stanley | $1,215,071 | $27,096,997 | 22.3:1 | VERY HIGH | 11.5% |
| Citigroup Inc | $2,352,945 | $42,547,285 | 18.1:1 | HIGH | 18.1% |
82.2:1
Highest Bank Leverage
(Goldman Sachs Bank)
(Goldman Sachs Bank)
156.8:1
Highest HC Leverage
(SMBC Americas)
(SMBC Americas)
94.2%
Market Share
Top 5 Banks
Top 5 Banks
$186.5T
Total Bank
Derivatives
Derivatives
ESG Securitization: New Risks in Sustainable Finance
Market Growth and Structure
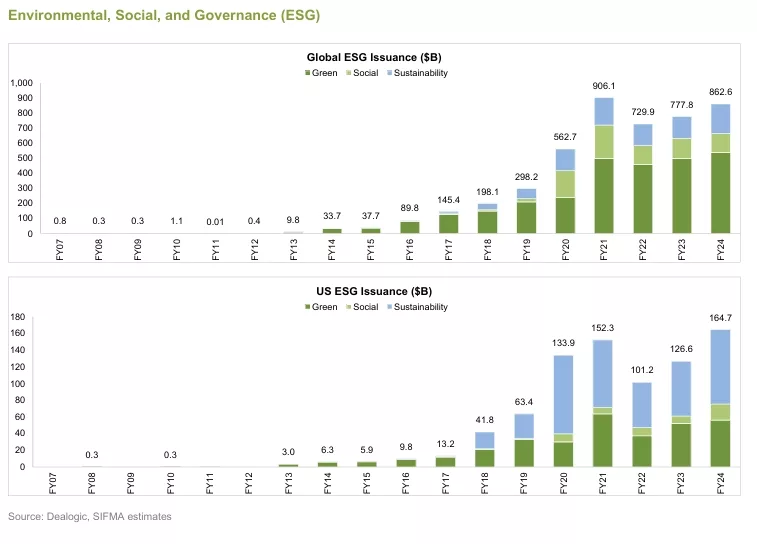
The ESG-linked securitization market has experienced substantial growth, with U.S. ESG-linked issuance rising to $47.7 billion in Q1 2025, representing an 8.1% year-over-year increase. This growth trajectory reflects the broader institutional shift toward sustainable investing, driven by regulatory pressures, investor demand, and corporate sustainability commitments. However, the underlying composition of this growth reveals significant structural imbalances that warrant careful examination.
Sector Breakdown Analysis
The divergent performance across ESG securitization categories highlights evolving market dynamics and investor preferences. Social bonds have demonstrated remarkable resilience with 45% year-over-year growth, primarily driven by post-pandemic focus on healthcare infrastructure, affordable housing initiatives, and social equity programs. This growth has been particularly pronounced in the healthcare real estate and affordable housing sectors, where clear social impact metrics provide investors with tangible outcome measurements. Sustainability bonds, encompassing mixed-use environmental and social projects, have shown solid 28% growth year-over-year. These instruments have gained traction among institutional investors seeking diversified ESG exposure without limiting themselves to purely environmental or social outcomes. The flexibility inherent in sustainability bond structures has made them attractive vehicles for financing complex infrastructure projects that address multiple ESG objectives simultaneously. Conversely, green bonds have experienced a sharp 39.7% decline year-over-year, representing a significant market correction. This decline can be attributed to several factors: increased scrutiny over “green” classifications, rising interest rates making long-term environmental projects less attractive, and market saturation in certain green asset classes. Additionally, regulatory uncertainty around taxonomy standards and the evolving definition of “green” activities have created hesitancy among both issuers and investors.
Systemic Risk Considerations
The rapid expansion of ESG securitization introduces several interconnected systemic concerns that extend beyond traditional credit risk assessment frameworks. The limited standardization in ESG criteria across different jurisdictions and rating agencies creates a fragmented landscape where similar underlying assets may receive vastly different ESG classifications. This inconsistency not only obscures underlying credit risk but also creates arbitrage opportunities that may not reflect genuine sustainability improvements. The “greenwashing” phenomenon in securitized products represents a particularly insidious risk, as it can lead to systematic mispricing of risk across entire asset classes. When ESG credentials are overstated or misrepresented, investors may accept lower yields for securities that do not actually deliver the promised environmental or social benefits. This mispricing can create asset bubbles in certain ESG-labeled securities while simultaneously undermining confidence in legitimate sustainable finance instruments.Regulatory frameworks for ESG securitization remain notably underdeveloped compared to traditional securitization markets. The absence of comprehensive oversight mechanisms creates potential for regulatory arbitrage and may leave investors exposed to risks that are not adequately captured in current supervisory frameworks. This regulatory gap is particularly concerning given the cross-border nature of many ESG-linked securities and the varying national approaches to sustainable finance regulation.
Transparency and Due Diligence Challenges
The transparency deficit in ESG-linked asset-backed securities represents one of the most significant obstacles to effective risk assessment and market development. Many ESG-linked ABS issuances demonstrate concerning gaps in disclosure that compromise investors’ ability to conduct thorough due diligence and accurately price securities. Limited loan-level data availability remains a persistent challenge across ESG securitization markets. Unlike traditional ABS markets where standardized reporting templates provide granular information about underlying assets, ESG-linked securities often lack comparable data granularity regarding the specific environmental or social characteristics of underlying loans or assets. This data scarcity is particularly problematic for renewable energy securitizations, where technical performance data, maintenance records, and long-term cash flow projections are essential for accurate risk assessment. The problem is compounded by the proprietary nature of many ESG data collection and verification processes. Third-party ESG data providers often use different methodologies and weighting systems, making it difficult for investors to compare securities across different issuers or even different tranches from the same issuer. This opacity creates information asymmetries that can lead to adverse selection problems, where issuers with weaker ESG credentials are more likely to access capital markets than those with stronger but less marketed sustainability profiles.
Methodological Inconsistencies
Inconsistent ESG scoring methodologies across the securitization market create significant challenges for risk assessment and portfolio management. Different rating agencies and ESG assessment firms employ varying frameworks for evaluating environmental impact, social benefits, and governance quality. These methodological differences can result in the same underlying asset pool receiving dramatically different ESG scores depending on the assessment framework employed.The temporal dimension of ESG scoring adds another layer of complexity. Unlike traditional credit metrics that can be updated regularly based on payment performance and asset values, ESG characteristics may change more slowly and require different monitoring approaches. For instance, the environmental impact of a green building may deteriorate over time due to maintenance issues, technological obsolescence, or changing environmental standards, but these changes may not be reflected in ESG scores until significant time has elapsed.
Performance Correlation Uncertainties
Unclear correlation between ESG criteria and credit performance represents a fundamental challenge for both pricing and risk management. While theoretical frameworks suggest that better ESG characteristics should correlate with improved long-term financial performance, empirical evidence in the securitization context remains limited and mixed. This uncertainty is particularly pronounced for newer ESG asset classes where historical performance data is insufficient to establish reliable correlations. The challenge is further complicated by the multi-dimensional nature of ESG factors and their potential interactions with traditional credit risk drivers. For example, energy-efficient buildings may have lower operating costs and higher tenant retention rates, potentially improving cash flows and reducing credit risk. However, these same properties may require higher upfront capital investments or ongoing maintenance costs that could offset some financial benefits. Without clear empirical evidence of these relationships, investors struggle to accurately price the credit implications of ESG characteristics.
Systemic Implications
These transparency gaps collectively contribute to systemic risks that extend beyond individual security performance. Information asymmetries and inconsistent risk assessment methodologies can lead to misallocation of capital, where resources flow to less deserving projects simply because they are better marketed or assessed by more favorable methodologies. This misallocation not only reduces the efficiency of capital markets but also undermines the broader objectives of sustainable finance by potentially directing investment away from projects with genuine environmental or social benefits. The interconnected nature of these challenges suggests that addressing transparency and due diligence issues in ESG securitization will require coordinated efforts across multiple stakeholders, including regulators, rating agencies, data providers, and market participants. Without such coordination, the ESG securitization market may struggle to achieve its potential as a vehicle for scaling sustainable finance while maintaining appropriate risk management standards.
Strengthening Financial Regulation: Addressing SPV Risks and Regulatory Arbitrage
Reinstating and Strengthening the Volcker Rule
The Volcker Rule’s original intent to prohibit proprietary trading by banks while allowing market-making activities has been significantly weakened through exemptions, particularly for repo trading. This erosion has created dangerous vulnerabilities in the financial system: Repo Market Risks: The exemption for repo trading has allowed banks to effectively engage in proprietary trading under the guise of market-making, particularly in Treasury and agency MBS repos. During the March 2020 liquidity crisis, these exposures amplified systemic stress as banks struggled to roll over positions. Shadow Banking Linkages: The exemptions have enabled banks to maintain tight connections with shadow banking entities through repo financing of securitized products, creating channels for contagion. Financial Stability Measures Proposals: Eliminate repo trading exemptions: All repo activity should be subject to strict market-making provisions with demonstrable customer demand. Quantitative metrics: Implement tighter limits on inventory aging (e.g., 60-day maximum holding period for any security).Enhanced disclosure: Require daily reporting of repo positions to regulators with public quarterly aggregates
Comprehensive SPV Supervision Reform
The current laissez-faire approach to Special Purpose Vehicles (SPVs) has created a parallel banking system with minimal oversight. The single-owner SPV model represents particular dangers: Structural Flaws of Single-Owner SPVs: When sponsors retain effective control through total return swaps or other synthetic exposures.Capital arbitrage: Used primarily to circumvent regulatory capital requirements rather than achieve true risk transfer. Liquidity illusion: Creates false sense of market depth that evaporates during stress periods.
Necessary Financial Stability Measures
Ban single-owner SPVs: Require minimum 3-5 independent investors with no single entity controlling >30% of interests, make sure none of the originator Bank and subsidiaries employees are at the same time owners of SPVs that provide Synthetic Risk Transfer to the same originator bank where they are employed. Capital requirements: Apply Basel III standards to SPVs based on their asset holdings, with: 8% minimum capital for investment grade securitizations, 12% for high yield/non-rated exposures, Additional countercyclical buffers during credit booms. Liquidity requirements: LCR/NSFR compliance for SPVs holding >$1B in assets. Consolidation Rules: Automatic consolidation: Require sponsor balance sheet consolidation for any SPV where: Sponsor retains >25% economic interest through derivatives, Provides >50% of funding through repos or credit lines, Has contractual obligation to provide liquidity support.
Closing Tax Avoidance Loopholes
The synthetic risk transfer and off-balance sheet ecosystem serves dual purposes of regulatory and tax arbitrage that must be addressed holistically. Tax Avoidance Mechanisms: Double-dip deductions: SPVs in tax havens claiming deductions on payments to parent while parent also deducts funding costs.Earnings stripping: Using interest payments to SPVs to reduce taxable income in high-tax jurisdictions. Deferral strategies: Parking assets in offshore SPVs to defer U.S. taxation indefinitely. Controlled SPV classification: Treat all SPVs with >50% sponsor economic interest as domestic entities for tax purposes. Withholding taxes: Impose 30% withholding on all payments to SPVs in non-cooperative jurisdictions. Anti-stripping rules: Disallow interest deductions for payments to thinly-capitalized SPVs (<10% equity).
International Coordination
The global nature of SPV structures requires coordinated policy responses.OECD/FSB Initiatives: Common SPV registry: Global database tracking ownership chains and asset flows. Harmonized capital standards: Prevent regulatory shopping by aligning SPV requirements across jurisdictions. Information sharing: Automatic exchange of SPV tax and regulatory data between authorities.
EU-U.S. Regulatory Alignment, Mutual recognition: Of SPV oversight regimes to close cross-border loopholes, Joint examinations: Of global SPVs and credit hedge funds by both jurisdictions,Parallel enforcement: Coordinated sanctions for violations of transparency rules.
Critical Findings
The analysis presented in this report demonstrates that current U.S. financial market conditions exhibit characteristics of a “liquidity illusion” – where abundant short-term funding masks growing systemic vulnerabilities in securitized product markets. While SOFR volumes and rate stability suggest robust market conditions, the underlying structure creates dependencies that could amplify future shocks. The key insight is that modern financial risk has evolved beyond the direct balance sheet exposures that dominated pre-2008 crises. Today’s risks operate through complex webs of funding dependencies, off-balance sheet structures, and collateral relationships that can transmit stress rapidly across the financial system.
Hidden Credit Risk: Adjusted NPL ratios that include securitized exposures are 10-100% higher than reported figures. Systemic Dependencies: An estimated $762B | $1.27T of daily funding indirectly supports securitized products. Regulatory Gaps: Current oversight frameworks inadequately address off-balance sheet securitization risks. Stress Vulnerability: Moderate stress scenarios could generate $45-65B in system-wide losses.
The Path Forward: Addressing these fragilities requires a multi-faceted approach combining enhanced regulatory oversight, improved market transparency, and strengthened risk management practices. The goal is not to eliminate securitization – which provides valuable economic benefits – but to ensure that its risks are properly measured, managed, and mitigated. The window for preventive action remains open, but it may not remain so indefinitely. History suggests that liquidity illusions can persist for extended periods before resolving suddenly and dramatically. Policymakers and market participants would be well-served to act on these insights before market conditions force their hand.
READ MORE:
https://www.ft.com/content/d91d35fc-93ab-4963-8587-7a00fe5c63b4
https://www.diamond-hill.com/insights/a-741/infographics/securitization-in-focus-november-2024
https://coinlaw.io/asset-backed-securities-industry-statistics
https://www.diamond-hill.com/insights/a-730/infographics/securitization-in-focus-october-2024
https://www.capitalone.com/commercial/insights/abs–clo-market-highlights-from-2024
https://vinodkothari.com/2025/01/secure-with-securitisation-global-volumes-expected-to-rise-in-2025
Appendices
Appendix A: Data Sources and Methodology
Primary Data Sources:
- SIFMA Quarterly Issuance Reports (Q1 2025)
- Federal Reserve H.8 Commercial Banking Data
- NY Fed SOFR and Repo Market Data
- Bloomberg Fixed Income and Securitisation Data
- Refinitiv Trading Volume Statistics
Appendix B: Technical Model Specifications
Funding Dependency Model:
Shadow_Funding_Exposure = SOFR_Volume × (ABS_Collateral_Share + MBS_Collateral_Share × Risk_Weight)
Where:
- ABS_Collateral_Share = Estimated proportion of ABS in repo collateral
- MBS_Collateral_Share = Estimated proportion of MBS in repo collateral
- Risk_Weight = Adjustment factor for credit quality
Appendix C: Historical Precedents
Relevant Historical Episodes:
- 2007-2008: Subprime mortgage crisis and repo market freeze
- 2020: COVID-19 market stress and Treasury market dysfunction
- 1998: Long-Term Capital Management and repo market contagion
Lessons Learned:
- Liquidity can disappear rapidly during stress periods
- Off-balance sheet structures can create unexpected exposures
- Interconnected funding markets can amplify shocks
Appendix D: International Comparisons
European Securitisation Market:
- Lower growth rates but higher regulatory oversight
- Enhanced transparency requirements
- Mandatory risk retention rules
Asian Markets:
- Rapid growth in securitisation issuance
- Limited regulatory frameworks
- Potential for future systemic risk
References
- Securities Industry and Financial Markets Association (SIFMA). (2025). First Quarter 2025 Issuance Report. New York: SIFMA.
- Federal Reserve Board. (2025). Assets and Liabilities of Commercial Banks in the United States – H.8. Washington, DC: Federal Reserve.
- Federal Reserve Bank of New York. (2025). Secured Overnight Financing Rate Data. New York: NY Fed.
- Financial Stability Board. (2024). Global Monitoring Report on Non-Bank Financial Intermediation. Basel: FSB.
- Bank for International Settlements. (2024). Quarterly Review: Developments in Repo Markets. Basel: BIS.
- Adrian, T., & Shin, H. S. (2010). Liquidity and leverage. Journal of Financial Intermediation, 19(3), 418-437.
- Gorton, G., & Metrick, A. (2012). Securitized banking and the run on repo. Journal of Financial Economics, 104(3), 425-451.
- Pozsar, Z. (2013). Institutional cash pools and the Triffin dilemma of the U.S. banking system. Financial Markets, Institutions & Instruments, 22(5), 283-318.
- Tuckman, B. (2010). Amending safe harbors to reduce systemic risk in OTC derivatives markets. Center for Financial Stability Working Paper.
- Duffie, D. (2019). Prone to fail: The pre-crisis financial system. Journal of Economic Perspectives, 33(1), 81-106.
This report was prepared for informational purposes and does not constitute investment advice. The views expressed are those of the authors and do not necessarily represent the views of any affiliated institutions.
Document Classification: Market Research
Distribution: Restricted